Sampling Techniques
Sampling Techniques. Dr. Shaik Shaffi Ahamed Ph.D ., Assistant Professor Department of Family & Community Medicine College of Medicine King Saud University. Why should we take sample?, Can’t we study the whole ?. It is possible depends on objective

Sampling Techniques
E N D
Presentation Transcript
Sampling Techniques Dr. Shaik Shaffi Ahamed Ph.D., Assistant Professor Department of Family & Community Medicine College of Medicine King Saud University
Why should we take sample?, Can’t we study the whole ? • It is possible • depends on objective • to know how many live in a country • -age and sex categories • -changing pattern of age structure • -when plan for country • CENSUS • -death in a hospital • record all the death • It is not possible • -to test the life of bulbs – burn bulbs till it lost its life • count of RBW in blood – draw all the blood & count • Count the stars in the sky • It is not necessary • - estimate Hb% in blood – a drop of blood is enough – blood in any part of the body will provide same
Populations and SamplingReasons for using samples There are many good reasons for studying a sample instead of an entire population: • Samples can be studied more quickly than populations. Speed can be important if a physician needs to determine something quickly, such as a vaccine or treatment for a new disease. • A study of a sample is less expensive than a study of an entire population because a smaller number of items or subjects are examined. This consideration is especially important in the design of large studies that require a long follow-up. • A study of the entire populations is impossible in most situations. • Sample results are often more accurate than results based on a population.
Sampling in Epidemiology • Why Sample? • Unable to study all members of a population • Reduce bias • Save time and money • Measurements may be better in sample than in entire population • Feasibility
Sampling Sampling is the process or technique of selecting a sample of appropriate characteristics and adequate size.
Terminology • Study Population • A population may be defined as an aggregate of all things / units possessing a common trait or characteristic. • The whole collection of units (“the universe”).
Terminology – Cont. • Target (Study) Population • The population that possesses a characteristic (parameter) which we wish to estimate or concerning which, we wish to draw conclusion. • The population you expect the eventual results of the research to apply (target of inference). • It may be real or hypothetical.
Terminology – Cont. • Sample • A selected subset of the study population. • Chosen by some process (e.g. sampling) with the objective of investigating particular characteristic (parameter) of the study population. • Sampling • Process of obtaining a sample from the target population.
Terminology – Cont. • Sampling Frame • This is the complete list of sampling units in the target population to be subjected to the sampling procedure. • Completeness and accuracy of this list is essential for the success of the study. • Sampling Units • These are the individual units / entities that make up the frame just as elements are entities that make up the population.
Terminology – Cont. Study Participants • Subjects that are actually participating in the study. • Subset of study population that were contactable and consented / agreed to participate.
Study Participants - Cont. Study participants may still be not representative of the target population even with random sampling because of: • Sampling frame is out of date. • Failure to recruit eligible subjects. • Non consent or non response. • Drop Out / Withdrawal.
Terminology – Cont. Sampling Error This arises out of random sampling and is the discrepancies between sample values and the population value. Sampling Variation • Due to infinite variations among individuals and their surrounding conditions. • Produce differences among samples from the population and is due to chance.
Repeat the same study, under exactly similar conditions, we will not necessarily get identical results. • Example: In a clinical trail of 200 patients we find that the efficacy of a particular drug is 75% If we repeat the study using the same drug in another group of similar 200 patients we will not get the same efficacy of 75%. It could be 78% or 71%. “Different results from different trails though all of them conducted under the same conditions”
Example: If two drugs have the same efficacy then the difference between the cure rates of these two drugs should be zero. But in practice we may not get a difference of zero. If we find the difference is small say 2%, 3%, or 5%, we may accept the hypothesis that the two drugs are equally effective. On the other hand, if we find the difference to be large say 25%, we would infer that the difference is very large and conclude that the drugs are not of equally efficacy.
Example: If we testing the claim of pharmaceutical company that the efficacy of a particular drug is 80%. We may accept the company’s claim if we observe the efficacy in the trail to be 78%, 81%, 83% or 77%. But if the efficacy in trail happens to be 50%, we would have good cause to feel that true efficacy cannot be 80%. And the chance of such happening must be very low. We then tend to dismiss the claim that the efficacy of the drug is 80%.
THEREFORE “WHILE TAKING DECISIONS BASED ON EXPERIMENTAL DATA WE MUST GIVE SOME ALLOWANCE FOR SAMPLING VARIATION “. “VARIATION BETWEEN ONE SAMPLE AND ANOTHER SAMPLE IS KNOWN AS SAMPLING VARIATION”.
Decisions Requiredfor selecting sample • Specify what is the target population. This is entirely determined by the research objective. • 2. Specify what is the study population. • (e.g. who are eligible for inclusion in the study) • 3. Select a sampling design for obtaining a sample for study. • 4. Strategy to ensure high response or participationrate, otherwise inference must take account of non-responses. • Decisions will have considerable impact on study validity (soundness of conclusion or inference made).
Study populations and samplingsummarized schematically Target population: real or hypothetical Select based on judgment and accessibility Study Population Probability sampling Sample Consent or respond Participants in study
How to sample ? In general 2 requirements Sampling frame must be available, otherwise construct one or use special sampling techniques. Frame construction may not be easy. Choose an appropriate sampling method to draw a sample from the frame.
Define the Population Determine the Sampling Frame Select Sampling Technique(s) Determine the Sample Size Execute the Sampling Process The Sampling Design Process Fig. 11.1
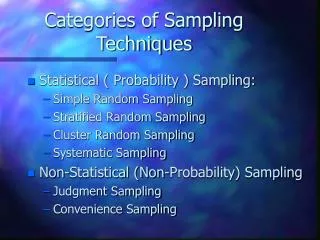
Sampling Techniques Nonprobability Sampling Techniques Convenience Sampling Judgmental Sampling Quota Sampling Snowball Sampling Classification of Sampling Techniques Fig. 11.2 Probability Sampling Techniques Simple Random Sampling Other Sampling Techniques Systematic Sampling Stratified Sampling Cluster Sampling
Simple Random Sampling • A sample may be defined as random if every sampling unit in the study population has an equal chance of being selected. • Selection of SRS may be done by: • Drawing the number or name from a hat or box. • Using a Random Number Table. • Using a computer to generate the numbers.
SRS Methods • Lottery Method • Random Number Table method
Example • A Tattslotto draw is a good example of simple random sampling. A sample of 6 numbers is randomly generated from a population of 45, with each number having an equal chance of being selected.
Tables ofrandomnumbers are used after numbers have been assigned to numbers of the study population. Use random number table to select subject. Start anywhere. Continue selecting until the desired sample is reached
1 2 3 4 5 Random Number table 49486 93775 88744 80091 92732 94860 36746 04571 13150 65383 10169 95685 47585 53247 60900 12018 45351 15671 23026 55344 45611 71585 61487 87434 07498 89137 30984 18842 69619 53872 94541 12057 30771 19598 96069 89920 28843 87599 30181 26839 32472 32796 15255 39636 90819
How to select a simple random sample • Define the population • Determine the desired sample size • List all members of the population or the potential subjects • For example: • 4th grade boys who have demonstrated problem behaviors • Lets select 10
1. Robert 2. Ralph 3. John 4. Andy 5. Joel 6. Thomas 7. Cooper 8. Maurice 9. Terry 10. Carl 11. Ken 12. Wilmer 13. Alan 14. Kevin 15. James 16. Henry 17. Don 18. Walt 19. Doug 20. George 21. Steve 22. Larry 23. Rick 24. Bruce 25. Clyde 26. Sam 27. Kent 28. Travis 29. Woody 30. Brian Potential Subject Pool
1. Robert 2. Ralph 3. John 4. Andy 5. Joel 6. Thomas 7. Cooper 8. Maurice 9. Terry 10. Carl 11. Ken 12. Wilmer 13. Alan 14. Kevin 15. James 16. Henry 17. Don 18. Walt 19. Doug 20. George 21. Steve 22. Larry 23. Rick 24. Bruce 25. Clyde 26. Sam 27. Kent 28. Travis 29. Woody 30. Brian So our selected subjects are numbers 10, 22, 24, 15, 6, 1, 25, 11, 13, & 16.
Simple random sampling • Estimate hemoglobin levels in patients with sickle cell anemia • Determine sample size • Obtain a list of all patients with sickle cell anemia in a hospital or clinic • Patient is the sampling unit • Use Lottery method/ a table of random numbers to select units from the sampling frame • Measure hemoglobin in all patients • Calculate mean and standard deviation of sample
Simple random sampling • Advantages • Simple process and easy to understand • Easy calculation of means and variance • Disadvantages • Not most efficient method, that is, not the most precise estimate for the cost • Requires knowledge of the complete sampling frame • Cannot always be certain that there is an equal chance of selection • Non respondents or refusals
Sampling in Epidemiology • Systematic sampling • The sampling units are spaced regularly throughout the sampling frame, e.g., every 3rd unit would be selected • May be used as either probability sample or not • Not a probability sample unless the starting point is randomly selected • Non-random sample if the starting point is determined by some other mechanism than chance
Systematic Sampling • The sample is chosen by selecting a random starting point and then picking every i th element in succession from the sampling frame. • The sampling interval, i, is determined by dividing the population size N by the sample size n and rounding to the nearest integer. For example, there are 100,000 elements in the population and a sample of 1,000 is desired. In this case the sampling interval, i, is 100. A random number between 1 and 100 is selected. If, for example, this number is 23, the sample consists of elements 23, 123, 223, 323, 423, 523, and so on.
Example • If a systematic sample of 500 students were to be carried out in a university with an enrolled population of 10,000, the sampling interval would be: • I = N/n = 10,000/500 =20 • All students would be assigned sequential numbers. The starting point would be chosen by selecting a random number between 1 and 20. If this number was 9, then the 9th student on the list of students would be selected along with every following 20th student. The sample of students would be those corresponding to student numbers 9, 29, 49, 69, ........ 9929, 9949, 9969 and 9989.
Systematic Sampling • Decide on sample size: n • Divide population of N individuals into groups of • kindividuals:k = N/n • Randomly select one individual from the 1st group. • Select every k-th individual thereafter. N = 64 n = 8 k = 8 First Group
Systematic sampling • Advantages • Sampling frame does not need to be defined in advance • Easier to implement in the field • If there are unrecognized trends in the sample frame, systematic sample ensure coverage of the spectrum of units • Disadvantages • Variance cannot be estimated unless assumptions are made
Stratified Sampling • A two-step process in which the population is partitioned into subpopulations, or strata. • The strata should be mutually exclusive and collectively exhaustive in that every population element should be assigned to one and only one stratum and no population elements should be omitted. • Next, elements are selected from each stratum by a random procedure, usually SRS. • A major objective of stratified sampling is to increase precision without increasing cost.
Stratified random sample • The sampling frame comprises groups, or strata, with certain characteristics • A sample of units are selected from each group or stratum
Sampling in Epidemiology • Stratified random sample • Assess dietary intake in adolescents • Define three age groups: 11-13, 14-16, 17-19 • Stratify age groups by sex • Obtain list of children in this age range from schools • Randomly select children from each of the 6 strata until sample size is obtained • Measure dietary intake
Stratified Random selection for drug trail in hypertension Severe Mild Moderate
Stratified random sample • Advantages • Assures that certain subgroups are represented in a sample • Allows investigator to estimate parameters in different strata • More precise estimates of the parameters because strata are more homogeneous, e.g., smaller variance within strata • Strata of interest can be sampled most intensively, e.g., groups with greatest variance • Administrative advantages • Disadvantages • Loss of precision if small number of units is sampled from strata
Cluster Sampling The population is first divided into mutually exclusively groups of elements called clusters. Ideally, each cluster is a representative small-scale version of the population (i.e. heterogeneous group). A simple random sample of the clusters is then taken. All elements within each sampled (chosen) cluster form the sample. Elements within a cluster should be as heterogeneous as possible, but clusters themselves should be as homogeneous as possible. Ideally, each cluster should be a small-scale representation of the population.
Cluster sampling • Estimate the prevalence of dental caries in school children • Among the schools in the catchments area, list all of the classrooms in each school • Take a simple random sample of classrooms, or cluster of children • Examine all children in a cluster for dental caries • Estimate prevalence of caries within clusters than combine in overall estimate, with variance
Cluster sampling • Advantages • The entire sampling frame need not be enumerated in advance, just the clusters once identified • More economical in terms of resources than simple random sampling • Disadvantages • Loss of precision, i.e., wider variance, but can be accounted for with larger number of clusters
Multistage Sampling • Similar to cluster sampling except that there are two sampling events, instead of one • Primary units are randomly selected • Individual units within primary units randomly selected for measurement
Multi–Stage Sampling • This sampling method is actually a combination of the basic sampling methods carried out in stages. • Aim of subdividing the population into progressively smaller units by random sampling at each stage.
Sampling in Epidemiology • Multistage sampling • Estimate the prevalence of dental caries in school children • Among the schools in the catchments area, list all of the classrooms in each school • Take a simple random sample of classrooms, or cluster of children • Enumerate the children in each classroom • Take a simple random sample of children within the classroom • Examine all children in a cluster for dental caries • Estimate prevalence of caries within clusters than combine in overall estimate, with variance
Sampling Techniques Nonprobability Sampling Techniques Convenience Sampling Judgmental Sampling Quota Sampling Snowball Sampling Classification of Sampling Techniques Fig. 11.2 Probability Sampling Techniques Simple Random Sampling Other Sampling Techniques Systematic Sampling Stratified Sampling Cluster Sampling