Sampling Techniques
Sampling Techniques. By Dr.S.Shaffi Ahamed. Why should we take sample?, Can’t we study the whole ?. It is possible depends on objective to know how many live in a country -age and sex categories -changing pattern of age structure -when plan for country Census -death in a hospital

Sampling Techniques
E N D
Presentation Transcript
Sampling Techniques By Dr.S.Shaffi Ahamed
Why should we take sample?, Can’t we study the whole ? • It is possible • depends on objective • to know how many live in a country • -age and sex categories • -changing pattern of age structure • -when plan for country • Census • -death in a hospital • -record all the death • It is not possible • -to test the life of bulbs – burn bulbs till it lost its life • count of RBW in blood – draw all the blood & count • Count the stars in the sky • It is not necessary • - estimate Hb% in blood – a drop of blood is enough – blood in any part of the body will provide same
Study subjects • May be people • -healthy or sick • -census of a certain disease • - clients of a clinic • -workers in a certain occupation • -recipients of a specified Rx • -people exposed to certain stimuli • (ii)May not be people • -in the case of vital events (births, deaths) • -records (vital, medical or civil) • -population may consist of health centers • -village units or hospital units • (iii) Time • - a Wednesday clinic/February births
Sampling in Epidemiology • Why? • Unable to study all members of a population • Reduce bias • Save time and money • Measurements may be better in sample than in entire population • Feasibility
Value of careful sampling - Presidential elections • Early 20th century – opinion was sampled haphazardly by asking passers-by on a street corner or selected group through mailed questionnaire. • Then improved system – use of telephone directories or automobile registration list or magazine subscription lists. • Literary Digest Magazine in USA in 1920, 1930 to predict election– correct in 1920,1924,1928 and 1934 elections • but failed in 1936 used 2 million responses. They ignored lower social classes who had neither telephone/automobiles. • Lessons were learned is the • The power of prediction is not necessarily a function of sample size; and • Sample should be representative of the population surveyed
When and Where sampling technique is appropriate • Vast data – No. of units is very large-S economizes money, time &effort • When utmost accuracy is not required – suitable in those situations where 100% accuracy is not required • Where census is impossible -- not enumerating all individuals • Homogeneity – if all the units are alike. S is very easy to use
Sampling Sampling is the process or technique of selecting a sample of appropriate characteristics and adequate size.
Sampling in Epidemiology • Definitions • Sampling unit – the basic unit around which a sampling procedure is planned • Person • Group – household, school, district, etc. • Component – eye, physiological response • Sampling frame – list of all of the sampling units in a population • Sample – collection of sampling units from the eligible population
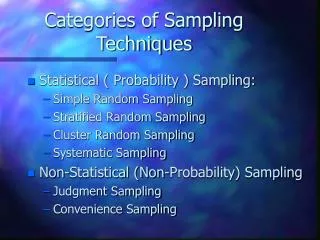
Non-random Sample Convenience sample Systematic sample Consecutive sample Quota sample Volunteer sample Capture-recapture Random Sample Simple random sample Stratified random sample Cluster sample Adaptive cluster sample Multistage sample Sampling in Epidemiology
Sampling in Epidemiology • Probability (random) sampling • Sampling in which each sampling unit has a known and nonzero probability of being included in the sample • Replacement • With replacement – sampling unit returned to population before next sampling event • Without replacement – sampling unit not returned to population before next sampling event
Simple Random Sampling Without Replacement A simple random sample is one in which each of the possible samples of elements taken from a population of elements has the same probability of selection. In a simple random sample without replacement, any element selected in a sample CANNOT be selected again for the same sample. • EXAMPLE A school with 500 students is randomly giving away five (5) prizes to its students during its year-end picnic. Each student's name is entered on a slip of paper and placed in a container. Names are to be drawn randomly from the container by the principal of the school. After the name of the winner of a prize is drawn and the prize awarded, the winner's name is left out of the container (not replaced). Therefore, once a student has been selected to win a prize, he or she cannot be selected again.
Sampling in Epidemiology • Simple random sampling • Each sampling unit has an equal chance of being included in the is sample • In epidemiology, sampling generally done without replacement as this approach allows for a wider coverage of sampling units, and as a result smaller standard errors
Sampling in Epidemiology • Simple random sampling • Advantages • Simple process and easy to understand • Easy calculation of means and variance • Disadvantages • Not most efficient method, that is, not the most precise estimate for the cost • Requires knowledge of the complete sampling frame • Cannot always be certain that there is an equal chance of selection • Non respondents or refusals
Sampling in Epidemiology • Simple random sampling • Estimate hemoglobin levels in patients with sickle cell anemia • Determine sample size • Obtain a list of all patients with sickle cell anemia in a hospital or clinic • Patient is the sampling unit • Use Lottery method/ a table of random numbers to select units from the sampling frame • Measure hemoglobin in all patients • Calculate mean and standard deviation of sample
SRS Methods • Lottery Method • Random Number Table method
Tables ofrandomnumbers are used after numbers have been assigned to numbers of the study population. Use random number table to select subject. Start anywhere. Continue selecting until the desired sample is reached
1 2 3 4 5 Random Number table 49486 93775 88744 80091 92732 94860 36746 04571 13150 65383 10169 95685 47585 53247 60900 12018 45351 15671 23026 55344 45611 71585 61487 87434 07498 89137 30984 18842 69619 53872 94541 12057 30771 19598 96069 89920 28843 87599 30181 26839 32472 32796 15255 39636 90819
Sampling in Epidemiology • Systematic sampling • The sampling units are spaced regularly throughout the sampling frame, e.g., every 3rd unit would be selected • May be used as either probability sample or not • Not a probability sample unless the starting point is randomly selected • Non-random sample if the starting point is determined by some other mechanism than chance
Sampling in Epidemiology • Systematic sample • Advantages • Sampling frame does not need to be defined in advance • Easier to implement in the field • If there are unrecognized trends in the sample frame, systematic sample ensure coverage of the spectrum of units • Disadvantages • Variance cannot be estimated unless assumptions are made
Sampling in Epidemiology • Systematic sampling • Estimate HIV prevalence in children born during a specified period at a hospital • Impossible to construct sampling frame in advance • Select a random number between some pre-specified bounds • Beginning with the random number chosen, take every 5th birth and measure for HIV infection
Sampling in Epidemiology • Stratified random sample • The sampling frame comprises groups, or strata, with certain characteristics • A sample of units are selected from each group or stratum
Stratified Random selection for drug trail in hypertension Severe Mild Moderate
Sampling in Epidemiology • Stratified random sample • Advantages • Assures that certain subgroups are represented in a sample • Allows investigator to estimate parameters in different strata • More precise estimates of the parameters because strata are more homogeneous, e.g., smaller variance within strata • Strata of interest can be sampled most intensively, e.g., groups with greatest variance • Administrative advantages • Disadvantages • Loss of precision if small number of units is sampled from strata
Sampling in Epidemiology • Stratified random sample • Assess dietary intake in adolescents • Define three age groups: 11-13, 14-16, 17-19 • Stratify age groups by sex • Obtain list of children in this age range from schools • Randomly select children from each of the 6 strata until sample size is obtained • Measure dietary intake
Sampling in Epidemiology • Cluster sampling • Clusters of sampling units are first selected randomly • Individual sampling units are then selected from within each cluster
Sampling in Epidemiology • Cluster sampling • Advantages • The entire sampling frame need not be enumerated in advance, just the clusters once identified • More economical in terms of resources than simple random sampling • Disadvantages • Loss of precision, i.e., wider variance, but can be accounted for with larger number of clusters
Sampling in Epidemiology • Cluster sampling • Estimate the prevalence of dental caries in school children • Among the schools in the catchments area, list all of the classrooms in each school • Take a simple random sample of classrooms, or cluster of children • Examine all children in a cluster for dental caries • Estimate prevalence of caries within clusters than combine in overall estimate, with variance
Sampling in Epidemiology • Multistage sampling • Similar to cluster sampling except that there are two sampling events, instead of one • Primary units are randomly selected • Individual units within primary units randomly selected for measurement
Sampling in Epidemiology • Multistage sampling • Estimate the prevalence of dental caries in school children • Among the schools in the catchment area, list all of the classrooms in each school • Take a simple random sample of classrooms, or cluster of children • Enumerate the children in each classroom • Take a simple random sample of children within the classroom • Examine all children in a cluster for dental caries • Estimate prevalence of caries within clusters than combine in overall estimate, with variance
Sampling in Epidemiology • Convenience sample • A non-random collection of sampling units from an undefined sampling frame • Advantages • Convenient and easy to perform • Disadvantages • Not statistical justification for sample
Sampling in Epidemiology • Convenience sample • Case series of patients with a particular condition at a certain hospital • “Normal” graduate students walking down the hall are asked to donate blood for a study • Children with febrile seizures reporting to an emergency room Investigator decides who is enrolled in a study
Sampling in Epidemiology • Consecutive sample • A case series of consecutive patients with a condition of interest • Consecutive series means ALL patients with the condition within hospital or clinic, not just the patients the investigators happen to know about • Advantages • Removes investigator from deciding who enters a study • Requires protocol with definitions of condition of interest • Straightforward way to enroll subjects • Disadvantage • Non-random
Sampling in Epidemiology • Consecutive sample • Outcome of 1000 consecutive patients presenting to the emergency room with chest pain • Natural history of all 125 patients with HIV-associated TB during 5 year period Explicit efforts must be made to identify and recruit ALL persons with the condition of interest
Suniti Solomon et al Prevalence and risk factors of HIV 1 and HIV 2 infection in Urban and rural areas in TN. Int. J. of STD & AIDS 1998;9:98-103 Objective: Find prevalence and risk factors. Setting: Centres in metropolitancity & municipality. Subjects: Individuals in Tamil nadu. Sampling Porcedure: “ Health camps were organised in 5 urban and 5 rural centres to cover entire state graphically” “ Every third person screened, in the active reproductive age group, were recruited as a subject. At each camp the inclusion of subjects continued until 200 persons were recruited”
Mary Sexton et al. • Sex differences in the use of asthma drugs: Cross-sectional study. • BMJ 1998; 317: 1434-7 • Objective : To assess the use of asthma drugs. Design : Cross-sectional study. Setting: Six general practices in East Anglia. • Subjects : Adults aged 20-54 with Asthma • Sampling method • “identify cases with asthma received drugs one year before – through database from each participating practices. The sample was stratified into three categories of severity corresponding the prescribed drugs • Bronchodilator alone (mild) 38% • Steroids (moderate) 57% • Nebulizer treatment (severe) 5% • Use SRS to select subject in each practice based on proportion of use of each type of drug within the practice
S. Anuradha Genital ulcer disease and acquisition of HIV infection. Indian J Med Microbiol 1992; 10(4):265-269 Objective : To find out the association of HIV infection with genital ulcer disease . Setting : Dept. of STD, GGH, Chennai. Subjects : Individials attending the STD dept. Sampling procedure ‘ Blood samples from first 20 patients were taken for analysis once a week for 40 weeks’. Statistical analysis : Data were analysed by using SPSS/PC + ver 4.0. The strength of association between the variables and HIV serological status was estimated using odds ratio (OR) and their 95% Confidence Intervals(CI)
Reidy A et al. Prevalence of series eye disease and visual impairement in a north London population: Population based, cross sectional study. BMJ 1998; 316:1643- Objective: To estimate eye disorders and of visual impairement Design: Cross-sectional survey. Setting : General Practices in metropolitan in England. Subjects: aged 65 or older & registered
Sampling Procedure 17 general practice group Random sampling 7 were selected People age 65 or older were registered with the general practices. Total 750-850 in each Gen Pract Use SRS to select eligible people in each practice One third in each practices were selected to form survey sample
A die is rolled to decide which one of the six volunteers will get a new , experimental vaccine • Simple Random sampling • Stratified random sampling C. Cluster sampling D. Systematic random sampling
A sample of students in a school is chosen as follows: Two students are selected from each batch by picking roll number at random from the attendance registers • Simple Random sampling • Stratified random sampling C. Cluster sampling D. Systematic random sampling
4. A target population for a telephonic survey is picked by selecting 10 pages from a total of 100 pages from a telephone directory by using a table of random numbers. In each of the selected pages, all listed persons are called for Interview • Simple Random sampling • Stratified random sampling C. Cluster sampling D. Systematic random sampling
The number 35 is a two-digit random number generated by a calculator. A sample of two wheelers in a state is selected by picking all those vehicles have registration numbers ending with 35 • Simple Random sampling • Stratified random sampling C. Cluster sampling D. Systematic random sampling