Download
1 / 25
270 likes | 405 Vues
Estimating the future demand for care. Elizabeth M. King*, Hannah Randolph and Maria Floro ** *The Brookings Institution, Washington, DC ** American University, Washington, DC. Please, do not distribute outside of conference. Work in progress only.

E N D
Estimating the future demand for care Elizabeth M. King*, Hannah Randolph and Maria Floro** *The Brookings Institution, Washington, DC ** American University, Washington, DC Please, do not distribute outside of conference. Work in progress only. Presented at 2018 Annual Meeting of the Research Project “Care Work and the Economy: advancing policy solutions with gender-aware macroeconomic models” in Berlin, October 21-23
Motivation • Care needs are intensifying but diversely, due to different patterns of demographic change – how to meet those care needs? • Women have been the primary provider of unpaid direct and indirect care in the household. How can women increase their labor force participation and earnings while also bearing this burden? • This paper uses the perspective of the household to estimate the future demand for care in different populations
Presentation in three parts Part 1 • Aggregate demand: Projecting care needs by country income groups (“extensive margin of care”) • Estimating future populations ill and disabled, by country income groups Part II • Using time use data to estimate the burden of care on the household and to understand how household composition affects that burden (“intensive margin of care”) • Estimates for Ghana and Mongolia using their time use data Part III • Relative care intensity scale derived from analysis of time use data • Projecting care needs using this data-based scale
Population structures determine the future need and demand for care • Data source • UN population estimates and projections, 2015 and 2030, by income country group • Diverse patterns across country income groups, but those patterns will intensify between 2015 and 2030 • Middle-income countries have the bulk of the world’s population: young, but promises a “demographic dividend” because of falling fertility rates • Low-income countries, mostly in Africa, are very young populations. Fertility rates are above 3 percent for many countries • High-income countries are aging and will continue to do so
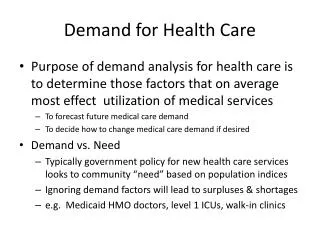
An epidemiological transition is changing the sources of morbidity and mortality • Public health improvements, medical advances, and economic growth have reduced the toll from communicable diseases worldwide • Noncommunicable diseases become more important as incomes grow and populations age. Seen most in middle-income countries • Data sources • Institute for Health Metrics and Evaluation (IHME) estimates of years lost due to disability (YLDs) • YLDs represent the burden of disease on the population in a given year. • Projected disability rates are a straight-line fit on yearly IHME YLD rate estimates from 2010-2016, projected forward to 2030
Unpaid household care: estimating the intensive margin of care demand and supply • Population and YLD projections provide an estimate of the extensive margin of care needs and demand – but what about the intensity of care for different types of dependents? • Durán Heras (2012) and others have developed scales of care units that can be used to translate population projections into estimates of future care needs. (e.g. Durán 2012) • Demographic definition of dependence: “Dependence indices do not weight, they only express a ratio. ...they weight the entire population with one unit of care“ (p. 424) • Current scales to translate demographic statistics into care weights averaged from expert opinion from focus groups (e.g. Durán Heras, 2012). Weights relative to a central group
Relative care intensity scale approach • We use time use and household composition data in regression analysis to describe how household unpaid care is allocated among household members • Aim is to construct a scale or index that weights different household members according to their age, relative to adults in a middle age group (e.g., ages 18-64) • And the weights are derived from a regression analysis of household unpaid care time against the household composition (count of household members by age group) • Age groups (e.g., 0-4, 5-17, 18-64, 65-74, 75+) but time use surveys differ with respect to age categories • Note: Need to use time use data that include time from all household members, not just from 1-2 household members
Measurement issues common to time use data • Unpaid care work often includes only primary activities; secondary or overlapping activities are missed underestimates intensity of care time • Unpaid direct care work might not be reported separately from other types of unpaid work underestimates direct care time • Survey respondents may not include all household members underestimates household care time • Care work may be received from a paid worker at home or in a center underestimates care needs unless specific data available • Care work may be provided by an unpaid non-household member underestimates care needs • Recipients of care work may not be adequately identified (important if care work is provided to another household as unpaid care) overestimates household need • Time use data confound supply and demand “reduced form” analysis
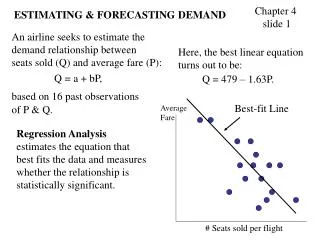
Regression analysis of household unpaid care • Desirable to have aggregate primary and secondary activities, but usually only primary activities • Separate estimates for direct care and indirect care • Estimated linear and log-linear specifications, with quadratic term for count variables and pairwise interaction terms of count variables to estimate economies of scale and scope • Control variables: Sex and age of household head, urban/rural residence, ownership of land or livestock
Direct and indirect care work of women and men Ghana Mongolia
Elasticity: Percent change in direct care time in response to a one percent change in household member of a given age, primary activities only Estimates from separate log-linear regressions for unpaid direct (primary) care for children and for elderly members Estimates include elasticities of scale and scope Control variables: Gender and age of head; rural or urban residence; own land or livestock
Elasticity: Percent change in direct care time in response to a one percent change in household member of a given age, primary activities only Estimates from separate log-linear regressions for unpaid direct (primary) care for children and for elderly members Estimates include elasticities of scale and scope Control variables: Gender and age of head; rural or urban residence; own land or livestock
Elasticity: Percent change in indirect care time given a percent change in household member of a given age, primary activities only Estimates from log-linear regression for unpaid indirect (primary) care, from all household members, all female members, and all male members Estimates include elasticities of scale and scope Control variables: Gender and age of head; rural or urban residence; own land or livestock
A relative care intensity scale based on time use data • Does not assume one care unit per household member • Using regression analysis of time data, reflects economies of scale and scope within the household that may derive from social norms and household structure • Independent of time units • Still early days – need to explore how different such a scale would be in diverse contexts
Applying the relative care intensity index on population projections for 2030 Accounting for unpaid care in the household yields a different picture of the impact of demographic trends on the household economy and the burden of the absence of care services on its members, especially girls and women
Early days still … further work • Questions for further analysis • How to separate demand and supply forces on observed unpaid care time: would be used to have more control variables at individual and household levels • How to consider disability and illness when specific data are not available • How to take account of use of paid care services when specific data are not available • And of course • Estimate for as different and as many countries as possible • Apply index to aggregate population projections