Download
1 / 9
90 likes | 244 Vues
Estimating Changes in Future Transit Service to Meet Future Transit Demand. Mark Charnews Puget Sound Regional Council. Headway Adjustment Formula. Adjusted Headway = 60 ÷ maximum Forecast volume on line Bus vehicle capacity (standing) Or

E N D
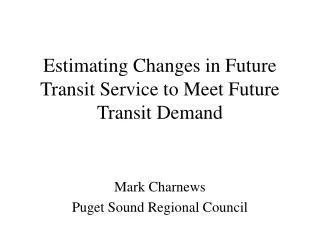
Estimating Changes in Future Transit Service to Meet Future Transit Demand Mark Charnews Puget Sound Regional Council
Headway Adjustment Formula Adjusted Headway = 60 ÷maximum Forecast volume on line Bus vehicle capacity (standing) Or the original headway, if smaller.
1998 2030 Pre-adjusted 2030 Adjusted Person Trips Mode Split Person Trips Mode Split Person Trips Mode Split Work 161,497 7.22% 365,901 11.48% 439,154 12.33% Non-work 120,845 1.50% 418,889 3.27% 516,571 4.03% Total 282,342 2.74% 784,790 5.04% 955,725 5.83% Table One Transit Trips by Purpose
Table Two Changes in Transit Service Due to Headway Changes SERVICE MILES 1998 AM hour OP hour Daily Annual Weekday Annual Total Bus 14,736 8,259 170,115 43,750,940 52,339,928 Ferry 163 126 2,198 566,196 697,469 Rail 7 7 112 28,782 36,270 2030 pre-adjustment Bus 12,379 8,116 153,504 39,508,816 47,949,200 Ferry 164 164 2,537 654,263 824,478 Rail 4,053 2,120 45,423 11,678,340 13,883,112 2030 adjusted Bus 18,875 13,110 240,677 61,962,640 75,597,056 Ferry 263 263 4,079 1,052,014 1,325,709 Rail 4,391 2,354 49,725 12,785,885 15,233,788