How to Evaluate a Basic Skills Program
This document outlines the crucial elements of program evaluation models, focusing on basic skills programs. It details various evaluation methodologies and measurement strategies, highlighting the importance of systematic information collection to enhance program effectiveness. Key evaluation designs such as pre/post-tests, group comparisons, surveys, and qualitative methods are discussed. The guide emphasizes the need for balancing realistic data collection with rigorous standards to measure the impact of interventions on students’ learning outcomes and participation rates.


How to Evaluate a Basic Skills Program
E N D
Presentation Transcript
How to Evaluate a Basic Skills Program Your Name Your Institution Date
Outcomes Describe the important elements of a program evaluation model, including different forms of evaluation and measurement Identify and describe different methodologies and measures that can be used with common intervention strategies in basic skills programs
Program Evaluation Evaluation is… “The systematic collection of information to make judgments, improve program effectiveness and/or generate knowledge to inform decisions about future programs.” (Patton, 1997)
Importance of Evaluation Demonstrates whether program/project is having desired impact on students Identifies what is working and what needs improvement Measures effect of any changes made within program/project Enables ongoing internal and external sharing/reporting of evaluative results Helps justify continued support and funding
Striking a Balance between Reality and Rigor First identify data already being collected Data collection should not place an undue burden on the program/project Use direct measures whenever possible and reasonable Need to ensure that data being collected are actually measuring what you intended to assess Requires conversation between program/project leaders and researcher to achieve a suitable balance
Pre/Post-Test Research Design Best way to measure improvement over time O X O O = Observation (Pre-test) X = Treatment (Classroom Intervention) O = Observation (Post-test)
Group Comparison Research Design Best way to compare treated and untreated groups Group 1 O X O Group 2 O O O = Observation (Pre-test) X = Treatment (Classroom Intervention) O = Observation (Post-test)
Surveys Best way to measure students’ attitudes, beliefs, and/or perceptions Can be used to enhance quantitative data (helps get at the HOW to resolve a problem) Can be pre/post-test or post-test only Can be group comparisons
Qualitative Methods Often asks the question of “how” and “why” instead of “what” Focuses on the details; more holistic Looks at the quality of relationships, activities, experiences, situations, or materials Types of methods • Participant observation • Direct observation • Interviews • Focus groups • Case studies
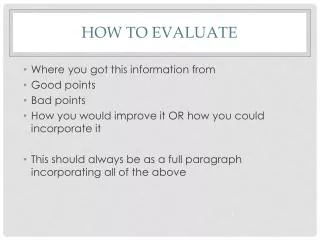
How to Do EvaluationWhat Data to Collect and Analyze to Demonstrate Program Effectiveness
How to Do Evaluation Specific Intervention Combined Effect Overall Program Professional Development
Specific Intervention Questions What would you want students who receive the intervention to gain? How would you know they achieved these desired outcomes? How do you think you could measure these desired outcomes? What else do you want to know about students’ experience with tutoring and how can you obtain this information?
Specific Intervention Participation/Usage 1 Compare the number of students and/of interactions before and after increased resources in like semesters to demonstrate that the increased resources resulted in increased usage • Example: Compare usage figures from Fall 2008 to Fall 2009 and Spring 2009 to Spring 2010
Specific Intervention Participation/Usage 2 Track students participation in various activities to demonstrate what proportion of freshmen are participating • Example: Examine participation numbers to identify high and low participation activities, determine in what combination students are participating; and track this information over time to determine if participation is changing
Specific Intervention Group Comparison 1 Compare success rates of students who received intervention to students who did not to demonstrate that intervention helped students achieve greater success • Example: Compare success rates of students in Math 70 who received tutoring to students in the same sections who did not
Specific Intervention Group Comparison 2 Compare persistence rates of students who received intervention to students that did not to demonstrate that the intervention helped students persist at a higher rate • Example: Compare persistence rates from Math 70 to Math 80 of students who received tutoring in Math 70 to those who did not
Specific Intervention Group Comparison 3 Compare success rates of students by the number of visits to examine whether there is a relationship between the number of visits and course success • Example: Among students who received tutoring for Math 70, compare the success rates of those students who had 1, 2-3, 4-6, 7-10, 11-15, 16-20, more than 20 visits
Specific Intervention Pre-/Post-Tests Assess students’ skills/knowledge, and/or abilities at the beginning and end their participation in longer-term activities to demonstrate that participation resulted in improvement • Example: Give students math skills test at beginning and end of Summer Bridge • Example: Have students self-assess their knowledge and skills related to college readiness at the beginning and end of the Counseling 50 course
Specific Intervention Formative Evaluation 1 Surveys, Interviews, and Focus Groups Survey students at the conclusion of the interaction to assess their satisfaction and their perceptions of how helpful the intervention was Survey/Interview/Focus groups with students at the end of their first and possibly second semesters to assess the longer-term impact of the intervention on their experience Include questions on institutional surveys to assess overall usage and satisfaction with the intervention
Specific Intervention Formative Evaluation 2 Surveys, Interviews, and Focus Groups Survey mentors/mentees or tutors/tutees to assess their experience with peer-based interventions Interview/Focus groups with faculty/staff who lead different programs to assess the effectiveness of the intervention from their perspective Survey/interview faculty at the end of the semester to assess their impressions of how helpful the intervention has been to the success of students in their classes
Combined Effect Question • What do you want to know about students’ participation in multiple activities and how can you obtain this information? The Ideal • Multiple regression analysis is the best method to examine and compare effects of multiple interventions because it allows for statistical isolation of variables related to the student and the interventions The Problem • Probably need assistance from IR to conduct this analysis Alternative Analysis • Less statistically-based method that can provide some insight into the effects of multiple interventions
Combined Effect Group Comparison Identify a targeted student population Document and track students’ participation in various activities Examine differences in success rates based on students’ participation to determine the individual and combined impacts of the interventions on student success
Example: Combined Effect In the population of freshman students in Fall 2010, document which students participated in Summer Bridge, Peer Mentoring, and/or Freshman Seminars. Divide these students into all the possible combinations of participation in the three activities: • None • Only bridge • Only mentoring • Only seminars • Bridge and mentoring • Bridge and seminars • Mentoring and seminars • All three
Combined Effect Formative Evaluation Survey/focus groups with participants and non-participants to assess their reasons for participating or not and determine how the two groups differ or are the same
Overall Program Purposes and Uses These assessments are designed to provide an overall examination to help identify possible areas in need of further investigation There are a number of assessments that can be done for the entire population or subsets of the population such as specific disciplines, course sequences, or individual courses
Overall Program Trend Analysis Examine success rates in each term at the course, discipline or overall levels to track student performance over time Examine persistence rates through each level in the course sequence to the transfer level to track student performance over time
Overall Program Longitudinal Analysis Track students to see what percentage persist to earn an associate degree within six years Track students to see what percentage persist to transfer to a four-year institution within six years
Overall Program Student Learning Outcomes (SLO) Examine SLO assessment data to determine how well students are achieving course SLOs Examine students’ performance related to program- and/or institutional-level SLOs Note: Important to remember context here.
Overall Program Formative Evaluation Survey students in the program to assess their participation in interventions, their reasons for participating or not, and their perceptions of the helpfulness of the interventions Survey faculty/staff in the program to assess their perception about the helpfulness of the interventions to their students
Professional Development Questions What would you want faculty/staff who participate in professional development to gain? How would you know they achieved these desired outcomes? How do you think you could measure these desired outcomes? What else do you want to know about faculty/staff’s participation in professional development and how can you obtain this information?
Professional Development Pre-/Post-Tests For individual instructors, compare success rates in sections of the same course prior to PD participation to demonstrate that the PD helped instructor improve student success Example: Compare success rates of Mr. Faculty’s English 90 sections that he taught in Fall 2008 and Spring 2009 before his participation in PD to the rates in his English 90 sections in Fall 2009 and Spring 2010 after his participation in PD Caution: While it addresses inter-instructor reliability, it does not account for other factors that can influence results because assessments occurring at different times
Professional Development Formative Evaluation Survey faculty and staff at the conclusion of each individual activity to assess their satisfaction Survey/Focus Groups with faculty and staff at a time after their PD experience to determine the applicability of what they learned and any suggested improvements for the PD they may have Survey/Focus Groups with students in class about newly implemented strategies to assess their experience and satisfaction
Importance of Isolation How do you know if the differences you found are a result of the intervention? Concept of isolation is one of the more important factors to consider when designing a study Important to isolate the effect of the intervention as much as possible What to consider when doing: • Group comparisons • Pre-/Post-test • Surveys • Trend Analysis
Two Common Questions How do we know if we are helping D/F students improve to earn a C or if students would have done the same without the interventions? Pre-/Post-tests and Group Administer pre- and post-tests in class to students who are receiving intervention and who are not and compare their improvement between the pre- and post-test. This method focuses on improvement instead of final grades. • Example: Compare improvement scores between students in Math 70 who used the Tutoring Center and those who did not
Two Common Questions 2. Are we simply attracting students to our programs who would succeed anyway? Group Comparisons Examine differences between participants and non-participants in: • Demographics (e.g., age, gender, ethnicity, others?) • Prior GPA • Prior course success • Placement level Survey/Focus Groups • Survey/Focus groups with participants and non-participants to assess their reasons for participating or not and determine how the two groups differ and/or are comparable
Reality Check Other Considerations Need to consider student inputs when evaluating results Need to consider context within which the program operates Consider potentially political nature of your data Consider the audience for your data
The BRIC Initiative BRIC: http://www.rpgroup.org/projects/BRIC.html The RP Group: http://www.rpgroup.org/ Contact: Rob Johnstone Project Director, rjohnstone@rpgroup.org Priyadarshini Chaplot Project Coordinator, pchaplot@rpgroup.org