Download
1 / 16
160 likes | 393 Vues
Teen Spending & Source of Income August, 2005. From ICR’s Teen Omnibus Survey Teen EXCEL (2001-2005). Contact: info@icrsurvey.com 53 W. Baltimore Pike, Media, PA 19063 484-840-4300 (p) • 484-840-4599 (f) •. I N T E R N A T I O N A L C O M M U N I C A T I O N S R E S E A R C H

E N D
Teen Spending & Source of IncomeAugust, 2005 From ICR’s Teen Omnibus Survey TeenEXCEL (2001-2005) Contact: info@icrsurvey.com 53 W. Baltimore Pike, Media, PA 19063 484-840-4300 (p) • 484-840-4599 (f) • I N T E R N A T I O N A L C O M M U N I C A T I O N S R E S E A R C H Custom Research • Information Analysis • ICR EXCEL omnibus services
Table of Contents Why Survey Teens? 3 Why ICR? 4 Methodology 5 Executive Summary 7 Detailed Findings 8 Methods of Obtaining Money 9 Disposable Income 10 Full or Part-time Job Trend (Boys vs. Girls) 11 Odd Jobs Trend (Boys vs. Girls) 12 Obtain Money from Parents Trend (Boys vs. Girls) 13 Disposable Income Trend (Boys vs. Girls) 14 2005 Source of Income Bar Chart (Boys vs. Girls) 15
Why Survey Teens? • They spend over $150 Billion per year • And influence their parents to spend more • They are confident consumers • They are tech savvy • They are aware that they are being marketed to • They are fierce individuals who view their friends as family • They are diverse • and pride themselves on their ability to move among peer groups • They are multitasking media “hounds”
Why ICR? • Accurate • Nationally representative of the entire US teen population, ages 12-17 • Telephone RDD (Random Digit Dial) • Affordable • Fraction of the cost of a custom survey • Just one question gets you access to all the demographics • Our scale (150,000 interviews per year) allows us to be priced much more competitively • Fast • One week from questionnaire to data delivery • Top line data available the day after interviewing ends; Reports one day after that • Teen Research Experts • ICR has done tens of thousands of interviews with teens • Focus groups, mall intercept, custom studies, web, teen omnibus
Methodology TeenEXCEL is a national monthly telephone omnibus service designed to meet quality standards associated with custom research studies. Sample Design Each TeenEXCEL survey consists of a minimum of 500 interviews, with 1/2 male and 1/2 female respondents aged 12 to 17. The age groups are further stratified by 12 to 14 year olds and 15 to 17 year olds. A representative sample is achieved using our targeted, pre-screened RDD samples. Sample telephone numbers are loaded into on-line sample files accessed directly by the CATI system. Within each sample household, one respondent is randomly selected using a computerized procedure. Field Period Interviewing for each TeenEXCEL survey is conducted, via CATI, over a 5-day period encompassing both weekdays and weekends. Up to four attempts are made to each sample number on various days and at different time periods.
Methodology (cont’d) Weighting Each TeenEXCEL is weighted to provide nationally representative and projectable estimates of the population 12 - 17 years old. The first step is to assign a pre-weight to each respondent that is determined by dividing the number of incoming telephone numbers in the household into the number of teens in the household. For most respondents, this weight will remain at 1.0. The second step is a simple ratio estimate. The 500 interviews are sorted into 16 cells and projected to the census population of the cell. These sixteen cells are from the four census regions, by the two sexes, by the two age groups (i.e., 12 to 14 and 15 to 17). Significant Differences Within this report, significant differences are reported at the 95% level of confidence.
Executive Summary Methods of Obtaining Money: Most teenagers obtain money from their parents when needed, as well as doing odd jobs occasionally to earn money. As might be expected, the smallest proportion actually have a regular full- or part-time job. • The trend among teens who obtain money from their parents has remained flat, despite a peak in 2003. • Significantly more teenage girls obtain money from their parents (87% vs. 77% boys). • The number of teens with a regular allowance has remained fairly steady after what seemed to be the start of an upward trend. • The number of teens who earn money occasionally doing odd jobs has decreased significantly since 2001. • Significantly more teenage boys indicate they earn money occasionally (73% vs. 65% girls). • The number of teens with a regular full- or part-time job decreased significantly in 2003 and has since remained steady. Disposable Income • Disposable income decreased from 2001 to 2003 and now seems to be turning around from its downward trend. However, it still hasn’t reached 2001 levels. • Teens ages 15 to 17 as well as teenage boys have had higher levels of disposable income; however, the levels of disposable income for teenage girls have surpassed that of boys in 2005 ($47 vs. $45 boys).
The trend among teens who obtain money from their parents has remained flat, despite a peak in 2003. The number of teens who earn money occasionally has decreased significantly since 2001. The number of teens with a regular allowance has remained fairly steady after what seemed to be the start of an upward trend. The number of teens with a regular full- or part-time job decreased significantly in 2003 and has since remained steady. 2001 2002 Teens base= (n=2542) (n=2535) (n=2531) (n=3534) (n=1366) D2a. Do you have a regular or full-time job? D2b. Do you earn money occasionally (doing odd jobs)? D2c. Do you have a regular allowance? D2d. Do you obtain money from parents when needed? Significant difference from indicated measure at 95% confidence level Base: Total respondents
As might be expected, teens ages 15 to 17 have a higher disposable income than the average teen. Disposable income decreased from 2001 to 2003 and now seems to be turning around from its downward trend. However, it still hasn’t reached 2001 levels. 2001 2002 2004 2001 2002 Teens base= (n=2542) (n=2535) (n=2531) (n=3534) (n=1366) Ages 15-17 base= (n=1289) (n=1276) (n=1280) (n=1804) (n=691) Significant difference from indicated measure at 95% confidence level Base: Total Respondents D3. How much did you spend in the last 7 days?
More teenage boys have a regular full- or part-time job. Boys base= (n=1272) (n=1257) (n=1264) (n=1773) (n=684) Girls base= (n=1270) (n=1278) (n=1267) (n=1761) (n=682) Significant difference from corresponding segment at 95% confidence level Base: Total respondents D2a. Do you have a regular or full-time job?
More teenage boys earn money occasionally doing odd jobs than do teenage girls. Boys base= (n=1272) (n=1257) (n=1264) (n=1773) (n=684) Girls base= (n=1270) (n=1278) (n=1267) (n=1761) (n=682) Significant difference from corresponding segment at 95% confidence level Base: Total respondents D2b. Do you earn money occasionally (doing odd jobs)?
More teenage girls obtain money from their parents when needed than do teenage boys. Boys base= (n=1272) (n=1257) (n=1264) (n=1773) (n=684) Girls base= (n=1270) (n=1278) (n=1267) (n=1761) (n=682) Significant difference from corresponding segment at 95% confidence level Base: Total respondents D2d. Do you obtain money from parents when needed?
In general, teenage boys have had a higher disposable income, although the average amount for teenage girls has now surpassed boys in 2005. Boys base= (n=1272) (n=1257) (n=1264) (n=1773) (n=684) Girls base= (n=1270) (n=1278) (n=1267) (n=1761) (n=682) Significant difference from corresponding segment at 95% confidence level Base: Total respondents D3. How much did you spend in the last 7 days?
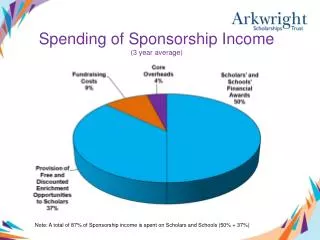
Significant difference from corresponding segment at 95% confidence level 2005 Source of Income Bar Chart (Boys vs. Girls). Significant difference in girls identifying parents and boys identifying odd jobs as source of income. D2a. Do you have a regular or full-time job? D2b. Do you earn money occasionally (doing odd jobs)? D2c. Do you have a regular allowance? D2d. Do you obtain money from parents when needed? Base: Total respondents
Teen Spending & Source of IncomeAugust, 2005 From ICR’s Teen Omnibus Survey TeenEXCEL (2001-2005) I N T E R N A T I O N A L C O M M U N I C A T I O N S R E S E A R C H Custom Research • Information Analysis • ICR EXCEL omnibus services