Download
1 / 29
330 likes | 652 Vues
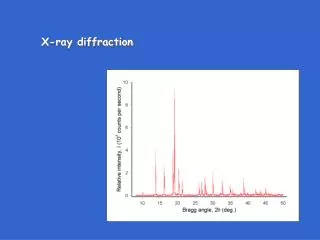
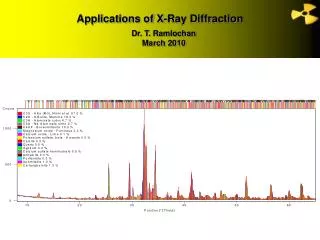
Applications of X-Ray Diffraction. Dr. T. Ramlochan March 2010. Applications of powder diffraction. Diffraction pattern gives information about peak positions , intensity , and shape

E N D
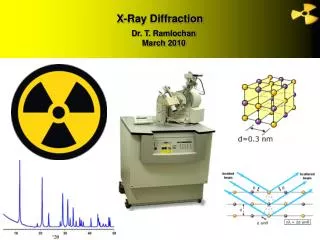
Applications of X-Ray Diffraction Dr. T. Ramlochan March 2010
Applications of powder diffraction • Diffraction pattern gives information about peak positions, intensity, and shape • Identification (qualitative) – most common use of powder diffraction is identification of crystalline phases (search/match); peak positions and intensity related to unique crystal structure • Quantification – determination of phase amounts in a polycrystalline material; peak intensity and shape related to concentration • RIR – reference intensity ratio • Whole-pattern fitting (Rietveld analysis) – computationally intensive; can only be applied with powerful analytical software. • Determination of crystallographic structure (i.e., unit cell) – much of X-ray diffraction is concerned with discovering and describing crystal structure
Phase identification • Diffraction patterns are unique fingerprints (distinct and reproducible) of the crystal structure of materials that can be used to determine phase composition of a polycrystalline material • “…every crystalline substance gives a pattern; the same substance always gives the same pattern; and in a mixture of substances each produces its pattern independently of the others.” -- A.W. Hull (1919), “A New Method of Chemical Analysis” Gypsum (CaSO4·H2O) layered structure and diffraction pattern
Phase identification • Phase identification is essentially an exercise of pattern comparison between the unknown and a database of single-phase reference patterns • Diffractogram is reduced to a table of ‘d-I’ pairs (d-spacing and relative intensity); some important information is lost
Search/Match • Search/Match – legacy (manual) method used database of index cards or books with d-I for reference materials • Tedious, time intensive, human error • OK for single phase, but multi-phase very difficult (1) file number, (2) three strongest lines, (3) lowest-angle line, (4) chemical formula and name of the substance, (5) data on diffraction method used, (6) crystallographic data, (7) optical and other data, (8) data on specimen, (9) diffraction pattern.
Search/Match • International Center for Diffraction Data (ICDD) current Powder Diffraction File (PDF-2 2006) database contains 186,107 entries of almost every known inorganic (159,809) and many organic (28,610) crystalline substances • Includes cell parameters, d-spacing, chemical formula, relative intensity, RIR • Software used to determine peak positions and intensities and used to search/match or compare with all (or subset/restrictions) of the ICDD PDF-2 database • Some knowledge about the material can be used to limit search • Reference patterns with high ‘score’ are visually compared with the sample data and best match(es) are selected by user • Works well for abundant phases, not so well for minor phases • Human error
Phase identification problems • Accurate line position is very important • Specimen displacement • geometry of diffraction requires that specimen lie on the focusing circle and be at the center of the diffractometer circle or will cause angular errors (e.g., if sample is “high” the detected ∆2θ will be positive) • Strain in crystal lattice • Macrostrain causes uniform strain in unit cell; unit cell dimensions and distances between planes altered; shifts the location of the diffraction peak in the pattern
Quantitative phase analysis: Intensity ratios • Concentration (wt%) (and density) of a particular phase is proportional to its intensity (peak area minus background, height?) • More crystallites, more reflections, greater intensity • Klug and Alexander (1954) were first to describe a technique for quantification using intensities of the crystalline phases in a mixture • Ratio of peak intensity from unknown phase ‘A’ (I?) to a standard ‘B’ (IS) is a linear function of the mass fraction of ‘A’ in the original sample • Use known amount of internal standard mineral (e.g., rutile) to calibrate the intensities of the unknown phase Calibration (regression) curve
Quantitative phase analysis: Intensity ratios • Use single peak only, generally most intense peak (I100%) • Requires fully resolved peak • Chose internal standard – must not overlap any other peaks; simple well-defined pattern (e.g., face centered cubic); same crystallite size as sample • Spiking (standard addition) – add extra wt% of desired phase to mixture and acquire at least 2 scans • External standard Calibration (regression) curve
Reference intensity ratio (RIR) • General formula for relating intensity ratio to mass fraction • ICDD PDF-2 uses corundum (Al2O3) as reference B and gives k for 50:50 mixture of phase A and corundum • RIR is I/Icor using intensity of the strongest peak (100%) • If I1/Icor is k1 and I2/Icor is k2, then I1/I2 is k1/k2 • If we know RIRs for every phase in mixture, we can determine the relative amounts of each phase (do not need corundum) because sum of all mass fractions equal 1 • Quick way to get ‘semi-quantitative’ information, but often inaccurate due irregularities in sample
Problems with intensity ratios • Uses single peak (I100%) • Ideal sample is homogeneous and the crystallites have a random distribution of all possible planes • Each possible reflection from a given set of h, k, l planes will have an equal number of crystallites contributing to it • Can only occur if particles are spherical • Crystal fragment shape is influenced by cleavage • Platy or acicular crystals will have dominant direction when compacted Cubic (110) (d2) family will have twice the intensity of the (100) (d1) family due to multiplicity
Problems with intensity ratios • Non-random distribution of the crystallites is referred to as preferred orientation (texture) • Most common cause of deviation of experimental data from the ideal intensity pattern • Intensity ratios are greatly distorted by preferred orientation • Minimise by back-loading sample, slurry with acetone
Problems with intensity ratios • Compositional variations (e.g., site occupancy) • Substitution of one atom for another in unit cell can alter intensities (impure phases or solid solution) Brownmillerite Ca2 Alx Fe2-x O5
Problems with intensity ratios • Peak overlap – can exaggerate intensity or obscure peak (not fully resolved) • Particular problem with clinker/cement
Problems with intensity ratios • Crystallite size (not necessarily same as particle size) • Large crystallites (i.e., thousands of unit cells) will produce sharp, very intense diffraction peaks only at the precise location of the Bragg angle (due to cancelling of diffractions by incoherent scattering). • Small crystallites (~1 µm) will produce broad peaks due to incoherent scattering at angles close to the Bragg angle • Large crystals increase microabsorption • <45 µm recommended, 2-10 µm optimal size, uniform size*, over grinding can cause amorphous layer
Problems with intensity ratios • Microabsorption • Strongly absorbing minerals (e.g., C4AF) will have reduced intensities • Weakly absorbing minerals (e.g., periclase) will have greater than average intensities. • Reduced by fine grinding • Not really a problem with internal standard approach
Problems with intensity ratios • Strain in crystal lattice • Non-uniform microstrain (due to dislocations, vacancies, impurities, etc.) results in peak broadening and possibly asymmetry
Other errors: • Flat specimen error • For correct diffraction geometry, sample should be curved and lie on focusing circle; flat sample causes an asymmetric peak broadening at towards lower 2θ angles • Fixed slit (vs. variable slit) • Larger area of sample irradiated at low 2θ values have less depth of penetration; at higher 2θ, irradiated area is smaller, but depth of penetration greater. These tend to offset, so get constant volume being irradiated. • Axial divergence • Occurs if X-ray beam diverges out of the plane of the focusing circle; causes peak asymmetry at low angles; soller slits and curved crystal monochromator limit divergence
Whole-pattern fitting (i.e., Rietveld analysis) • Rietveld (1969) developed a method to refine crystal structure information using neutron powder diffraction • Uses ‘initial’ crystal structure as a starting point to calculate the expected diffraction profile based on physics • Differences between the calculated profile and the measured profile are minimised by a least squares iterative approach • Uses all peaks and the complete profile (i.e., peak position, peak intensity, and peak shape) in the analysis • Many variables (errors) can be accounted for (e.g., preferred orientation, crystallite size, strain, peak overlap, peak asymmetry, site occupancy, absorption, diffraction geometry, etc.) • pattern is sum total of all of the effects • Can be used for standardless quantification of polycrystalline materials • Capable of much greater accuracy than intensity ratio methods
Rietveld analysis • How does it work? • Need to already know what is in the mixture (phase identification) • Need solved unit cell structural information for each compound in mixture • Unit cell parameters (dimensions, angles, crystal system, space group) • Atom type and positions (and site occupancy) • Inorganic Crystal Structure Database (ICSD) • Maintained by FIZ Karlsruhe and NIST • Contains 89,064 entries of inorganic crystal structure data (does not contain everything you may want)
ICSD database Calcite 80869
ICSD database • Super cell for alite (C3S) contains 226 atoms
Very computer intensive • 4320 calculated peaks contribute to final profile
Rietveld analysis benefits • Rietveld analysis has advantages over conventional Bogue calculations based on XRF data • Bogue assumes pure compounds (know this is not true) • Gives more accurate determination of major clinker phases • underestimates alite (up to 20%), overestimates belite (up to 10%) (Stutzman, 2004; Glasser, 2004), underestimates ferrite by ~2-3% (for high Fe2O3 clinker) (Feldman et al., 2005) • Polymorphism – can detect and quantify different polymorphs of compounds (e.g., cubic C3A, orthorhombic C3A) • Can detect and quantify other phases (e.g., free lime, periclase, calcium sulphates (different forms), alkali sulphates, etc.)
What about amorphous materials? • Rietveld gives a ‘normalised’ fit – assumes that everything is crystalline and sum of mass fractions add up to 1 (or 100%) • Can use internal standard (all peaks) to calibrate scale factors • Difference between calculated and actual is due to amorphous content e.g., Determination of glass content of blast-furnace slag