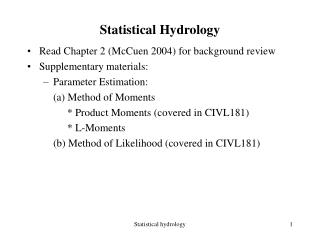
Statistical Hydrology
Picture in background . Statistical Hydrology. Understanding hydrology through statistics: Probability theory, estimates, and uncertainty. Picture: Railroad tracks in Minot, North Dakota surrounded by floodwaters of the Souris River.

Statistical Hydrology
E N D
Presentation Transcript
Picture in background Statistical Hydrology Understanding hydrology through statistics: Probability theory, estimates, and uncertainty Picture: Railroad tracks in Minot, North Dakota surrounded by floodwaters of the Souris River. Credit: Brent R. Hanson, U.S. Geological Survey, available at http://gallery.usgs.gov/photos/07_05_2011_jne5HtsGGB_07_05_2011_1
Why do we care about statistical hydrology? How much does the concentration of a particular contaminant vary? Has the water quality in a river or aquifer changed over time? What is the probability of a flood or drought occurring in a given year?
General learning objectives • Learning objective 1 – Define a random variable • Learning objective 2– Use data to characterize the properties of a random variable • Learning objective 3 – Applications of probability in hydrology
This module focuses on … PROBABILITY THEORY: What is a random variable? DATA AND PROBABILITY: How do you use data to characterize random variables? APPLICATIONS: What are some common ways statistics are used in hydrology?
By the end of this topic, you will be able to: • Define and identify a random variable • Link random variables to probability theory
Random variables arise from random phenomenon Random Variable (RV): variable whose possible values are numerical outcomes of a random phenomenon Related Terminology Experiment -- any process whose outcome is subject to uncertainty Sample Space S -- set of all possible outcomes; the population of all possible values of the RV Sample point x -- one single outcome Event E -- a subset of S
In hydrology, all aspects of the water cycle are random variables that can be expressed in probabilistic terms Modified from Brutsaert, 2005. Hydrology. Cambridge University Press
The number of rainy days in one week is a random variable Example: The number of rainy days in one week Experiment (process) -> Rainfall Random variable -> Number of rainy days in one week Sample space, S -> What are all of the possible numbers of days it might rain in one week? SUN MON TUES WED THURS FRI SAT ? ? ? ? ? ? ? ANSWER: Sample space is all possible values of the random variable. Here, this is the possible combinations of days that result in 0, 1, 2, 3, 4, 5, 6, or 7 days of rain.
Rain on Tuesday, Wednesday and Saturday is one outcome of this random process Example (continued): The number of rainy days in one week Sample point, x -> What is a single value (or outcome) of this random variable? ANSWER: Weather report for one week: SUN MON TUES WED THURS FRI SAT Event, E -> Weeks where it rains exactly 3 days.
The amount of rainfall in one week is another example of a random variable Example: The amount of rain in one week Experiment (process) -> Rainfall Random variable -> Total amount of rainfall in one week Sample space, S -> What are all of the possible values of rainfall that may fall in one week? SUN MON TUES WED THURS FRI SAT ? ? ? ? ? ? ? ANSWER: Here the total amount of rain in one week can be any value from 0 to infinity. Note that in the last example, only 8 values were possible.
Three inches of rain in one week is an outcome of this random process Example (continued): The amount of rain in one week Sample point, x -> What is a single value (or outcome) of this random variable? ANSWER: A single value of rainfall totals for one week SUN MON TUES WED THURS FRI SAT 0 0 1 0.5 0 0 1.5 In this week, it rained 3 inches. Event, E -> Weeks where it rains more than 2 inches.
Random variables are either discrete or continuous • Continuous: • Can take on a continuum values which cannot be enumerated • The chance of an event or outcome can only be expressed as a range of values: • The chance of rainfall exceeding 2 inches in one week • The chance of rainfall being between 2 and 3 inches in one week • Discrete: • Only have a finite number of outcomes which can be enumerated • The chance of an event or outcome can be expressed exactly: • The chance of 2 days of rain in one week • The chance of 7 days of rain in one week
Random variables in hydrology have several common properties • Most random variables are continuous • Often no values are below zero • A few values are much larger or smaller than most of the other observations (presence of outliers)
Review: Types of random variables • Are the random variables below discrete or continuous? A B The number of days a sample exceeding a phosphorus concentration of 0.5 mg/L in one year? The groundwater level on a given day? D C The annual peak streamflow? The number of days a reservoir was dry in one month?
Probability describes the chance of a particular outcome of a random variable Probability: how we describe the chance of particular experimental outcome • From the rainfall example: • What is the probability that X days of rain will occur in one week? • What is the probability that rainfall will exceed X inches in one week? We can think of the probability of a particular event occurring as the fraction of time the event occurs relative to all possible outcomes in S.
Example: What is the probability that 3 days of rain will occur in one week? SUN MON TUES WED THURS FRI SAT ? ? ? ? ? ? ? First, we need to understand how the sample space is partitioned: Sample space, S Event A Number of combinations of days that result in 3 rainy days per week Total number of combinations of rainy days per week
What is the probability that 3 days of rain will occur in one week? [F, Sa] [M, Sa] [M, Tu, W] [M, Sa, Su] Event A: Number of combinations of days of that result in 3 rainy days per week [M, Tu, Th] [Su, Tu] [M] [Tu, Th, F] … [M, Tu, W, Th] … [Tu, Th] Sample space, S: Total number of combinations of rainy days per week Using combinatorics, we can save time from having to enumerate all possible combinations: Probability that 3 days of rain will occur in one week = =
The probability of multiple events occurring is expressed through set operations Set Operations -- express how the sample space is partitioned into events and how events are related to one another • Mutually exclusive or disjoint events; empty set f Set operations can be expressed visually as Venn Diagrams -- the visual expression of set operations Union (A U B) Sample space, S Either A OR B occur Intersection (A ∩ B) Event B Event A Both A AND B occur (Ac) Complement All outcomes not included in the outcomes of event A
Example: What is the probability that 3 days of rain will occur in one week and that one of the days is a Monday? Sample space, S Event A Event B Number of combinations of days of that result in 3 rainy days per week Number of combinations that resulted in rain on Monday Which set operation do we use? Union Intersection Complement A ∩ B A U B Ac
Sample space, S Review: Set operations and probability Number of combinations of days of that result in 3 rainy days per week Number of combinations that resulted in rain on Monday Event A P (A ∩ B)= “The probability that events A and B occur” Event B Which outcomes belong in: Event B? 2) Event A ∩B? [F, Sa] [M, Sa] [M, Tu, W] [M, Sa, Su] [M, Tu, Th] [Su, Tu] [M] [Tu, Th, F] … [M, Tu, W, Th] … [Tu, Th]
Probability has several properties • For every event A, 0 ≤ Prob(A) ≤ 1 • If A cannot happen, then Prob(A) = 0 • For sample space S, Prob(S) = 1 • For mutually exclusive events A and B, Prob(A ∩ B) = 0 Sample space, S Event B Event A V. Griffis
How do we describe the probabilities of all possible events occurring? Let us consider again theprobability that X days of rain will occur in one week. SUN MON TUES WED THURS FRI SAT ? ? ? ? ? ? ? If we repeatedly this answered this question for each possible value (0 through 7), we would obtain the probability function If we summed all of the probabilities across all of the possible days, the probabilities would sum to 1. Probability that X days of rain will occur in one week . . . 2 7 0 1 X day
The probability function assigns a probability to the possible outcomes of a random variable • f(x) is a function that describes the probability of observing a given sample point or event contained in S. A probability function assigns a probability to every outcome in S. For a discrete random variable, each possible value will have a probability. Probability that X days of rain will occur in one week . . . 2 7 0 1 X day
Most variables in hydrology are described by continuous probability functions • Most watershed and environmental variables can take on any of a continuum of values. • Therefore, we cannot simply assign a probability to each outcome because there are an infinite number of outcomes. • Instead we use a continuous function and integrate across all the continuum of values. Example of a continuous probability function f(x) Can one determine the exact probability of a value occurring? Probability density 0 Value of the random variable
A theoretical probability distribution is commonly used to represent hydrologic processes • A theoretical probability distribution is a mathematical form, or characteristic shape. • It is often found that certain standard probability distributions represent environmental data very well, either naturally as a consequence of the data generating process, or empirically. Two common ways to represent continuous distributions Probability density function (pdf) Cumulative density function (cdf) probability 1 f(x) Which values are expected to be observed more frequently than others? What is the probability of an observed value being less than X? F(x) Cumulative probability Probability density f(x) X 0 0 xmin xmax xmin xmax Values of the random variable Values of the random variable
The Gaussian distribution is the most commonly used theoretical distribution • The most widely used continuous distribution is the Gaussian or normal distribution, following largely from some useful mathematical properties, like the Central Limit Theorem • The PDF for the Gaussian distribution is: • The CDF for the distribution is: • This is analytically intractable, so we usually use look-up tables for a standard normal distribution to estimate associated probabilities. This often requires that we transform the data we are using. • In order to use the distribution it is necessary to fit two parameters: the mean and standard deviation
Review: Probability Functions f(x) • Here is a pdf for the uniform distribution. 1. Why is it called the uniform distribution? 2. Graph the cdf. 1 Probability density f(x) = Cumulative probability 0 Values of the random variable 0 10 0 0 10 Values of the random variable 3. What is the probability of a value between 1 and 2 occurring?
Review: Random variables • What is the probability that the streamflow on a given day will not exceed 1 cubic feet per second? Experiment -> ? Random variable -> ? Sample space, S -> ? Sample point, x -> ? Event, E -> ? Is this a discrete or continuous random variable? • What are some other examples of random variables in the hydrologic cycle?
DATA AND PROBABILITY:How do you use data to characterize random variables?
By the end of this topic, you will be able to: • Use data to characterize random variables
DATA AND PROBABILITY:How do you use data to characterize random variables?
In practice, we make estimates of the true (theoretical) properties of random variables If we knew the actual (theoretical) probability function of a random variable, we would be able to compute the probability of any event or a combination of events occurring. Probability that X days of rain will occur in one week . . . 2 7 0 1 X day In practice, we can only take observations (samples) of random processes to estimate the properties of a random variable and understand the probability of an event. What are other examples of samples we collect in hydrology?
We makes estimates of a random variable by observing the phenomenon Using observations (samples of random processes) to estimate the probability function is one of the most fundamental analyses in statistical hydrology. • We infer population characteristics – characteristics about the entire sample space - from samples of data drawn from the random process. • We try to ensure that samples are "representative” • However, different samples yield different estimates • Uncertainty is unavoidable and an essential part of our knowledge.
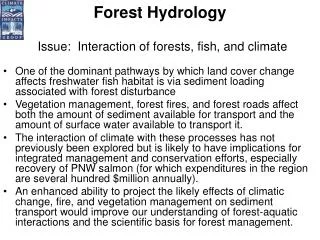
Observations - or samples of random variables – can be taken across space and time Example 1: Iron concentrations are to be predicted at low flow in numerous small streams in the coal-producing areas of eastern Ohio (Helsel, 1983). It is proposed that iron concentrations are influenced by site mining history (an unmined area, a reclaimed coal mine, or an abandoned coal mine) and underlying rock type (either a sandstone or limestone formation). Example 2: Total phosphorus loads are to be estimated for the Illinois River at Marseilles, Illinois, drainage area 8259 square miles, for the period 1972-1985. Examples from Statistical Methods in Water Resources by Helsel and Hirsch
The amount, timing, and location of samples can affect our estimates of the random process • The issue with many environmental phenomena such as these is the logistical and economic cost associated with sampling. We have to determine how to obtain (finite) unbiased estimates of population characteristics with sufficient accuracy. • Say we want to characterize the average value of the water table over a given year at a particular location. We have installed a well but can only afford to send someone out to measure the water level 30 times. • Is one of these sampling strategies better than the others? Why? A. Collect a water level measurement every day for 30 days. B. Collect a water level measurement every two weeks for the entire year. C. Collect a water level measurement 30 times but only in the summer.
Simple random sampling can be used to measure long-term behavior Say we have a finite population, X1, X2,…, Xn. We wish to estimate some basic properties of the population, like the average value, or the proportion of the population satisfying some condition. How do we choose an unbiased sample of the population, and how should we estimate it’s statistical properties? The simplest approach to gathering samples is to pick population members individually and sequentially at random with no replacement. Each member of a population (in time and space) is equally likely to be selected. Such an approach can allow us to measure long term behavior.
Stratified random sampling is used to separate estimates over space and time • Some advantages of a stratified population structure are: • It can improve the estimate • It may be more convenient • Estimate characteristics of the individual strata as well as the overall population We can estimate some characteristics more efficiently by sampling from stratum separately rather than sampling the population at large, if the variable of interest shows less variation within each stratum than in the total population. A stratified population is one that can be divided into natural groups in time or space, such as seasons (time) or regions (space)
We can summarize observations from data in many different ways • Characteristics often used to describe data include: • a measure of the center of the data (mean, median) • a measure of spread or variability (variance, standard deviation) • a measure of the symmetry of the data distribution (skewness) • estimates of extremes such as some large or small percentile • the complete probability distribution
Measures Of Central Tendency (Location) • Mean of a random variable X, m The mean is the expected value one would obtain from a sample of the random variable. The mean is in the same units as the random variable. • Median of a random variable X • The middle value in a data sample. Half of the observations are above this value and half are below. The median is in the same units as the random variable.
Outliers in samples can affect our estimates of the random process • Example: Concentration of sediment in a river cross-section. • Sediment concentrations closer to the river banks may be much higher than those in the center. Effect on the mean Mean with data outlier Mean without data outlier Concentrations in samples Concentrations in samples Data outliers are very common in environmental data and have an effect of how we characterize data. modified from Statistical Methods in Water Resources by Helsel and Hirsch
Mean versus median: Which should we use? Ammonia plus organic nitrogen (in mg/L) was measured in samples of precipitation by Oltmann and Shulters (1989). Which sample might be considered an outlier? Would the mean or median be more appropriate to estimate the mass of nitrogen falling per square mile?
Measures of Dispersion -- Scale Variance of a random variable X, s2 Measured in the squared units of the random variable. Standard deviation of a random variable X, Measured in the same units as the random variable. Coefficient of variation of a random variable X, CV Dimensionless ratio of σ / µ. • Sample variance: • Can assess precision of the mean • Can compare the sample mean with other estimators of the population mean • Can determine how large a sample is needed to get a certain precision Mean PROBABILITY Variance The sample variance and standard deviation are also affected by outliers, which will give the impression of more spread than indicated by the majority of the dataset.
Measures of Asymmetry - Skewness Coefficient of skewness, g Zero skew Positive skew Negative skew Median Mean Mean Median = Mean Median PROBABILITY PROBABILITY PROBABILITY DATA VALUES DATA VALUES DATA VALUES • Here are some observed well yields (in gal/min/ft): 0.001 0.030 0.10 0.003 0.454 0.007 0.041 0.49 0.077 1.02 • Is the skew: (a) zero, (b) positive, or (c) negative? modified from Statistical Methods in Water Resources by Helsel and Hirsch
Review: Characterizing data Let’s compare two probability density functions. A Same or different: 1. Mean? 2. Variance? B 3. Skewness?
Characterizing the complete sample distribution is also sometimes necessary • Measures of location, scale and skew of a data sample are useful in characterizing environmental data. • However, sometimes the full sample distribution must be quantified to answer questions about the hydrologic processbeing observed. What is the amount of precipitation we would expect for a 2-year storm? What is the flood magnitude expected to occur more than every 50 years? What is the probability of streamflow exceeding the 7-day, 10-year low flow value?
Histograms bin the observations to examine the frequency of occurrence • If the observations in the sample are identically distributed, they can be arranged to fill a frequency histogram. • This is done by dividing the variable into discrete intervals and counting the number of observations in each interval. The values on the y-axis are the number of concentration values observed to fall within each range on the x-axis. Is the distribution of suspended solids concentration skewed?
Boxplots visualize the major components and shape of the probability distribution A step equals 1.5 times the height of the box HYDROLOGIC VARIABLE OF INTEREST Interquartile range (IQR) Relation between a boxplot and the pdf Helsel and Hirsch, p. 25
Review: Histograms versus boxplots Maumee River, Ohio, USA Which graph would be best able to: • Estimate the variability of the data? • Visualize the pdf? • Determine the most frequent range of values? • Estimate the median of the data?
Empirical cdfs explicitly link probability to observations • Histograms and box plots can tell us about the shape and key features of the probability distribution; however, there is no explicit link to probability. • Often times we need to estimate a probability of a hydrologic exceeding - or not exceeding - a particular value. probability 1 • We can develop an empirical cdf using our hydrologic data to answer these type of questions. What is the probability of an observed value being less than X? F(x) Cumulative probability X 0 xmin xmax Values of the random variable