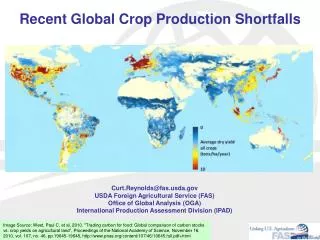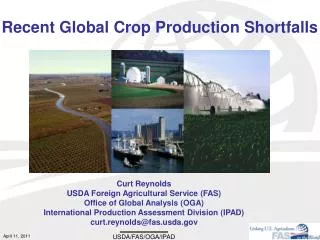
Recent Global Crop Production Shortfalls
350 likes | 520 Vues
Recent Global Crop Production Shortfalls. Curt Reynolds USDA Foreign Agricultural Service (FAS) Office of Global Analysis (OGA) International Production Assessment Division (IPAD) curt.reynolds@fas.usda.gov. Outline. USDA’s Global Economic Intelligence System Recent Crop Production Shortfalls

Recent Global Crop Production Shortfalls
E N D
Presentation Transcript
Recent Global Crop Production Shortfalls Curt ReynoldsUSDA Foreign Agricultural Service (FAS)Office of Global Analysis (OGA)International Production Assessment Division (IPAD)curt.reynolds@fas.usda.gov USDA/FAS/OGA/IPAD
Outline • USDA’s Global Economic Intelligence System • Recent Crop Production Shortfalls • Episodic Heat Waves and Mega-Droughts Impacts on Global Crop Production • Example: Russia’s Drought last Summer (July/August 2010) • Summary Satellites Used by USDA/FAS for Global Crop Monitoring USDA/FAS/OGA/IPAD
National Agricultural Statistics Service (NASS) Joint Agricultural Weather Facility (JAWF) Foreign Agricultural Service (FAS) Economic Research Service (ERS) Farm Service Agency (FSA) Domestic Production and Stocks Estimates World Agricultural Supply and Demand Estimates FAS Commodity Circulars PSD (Production,Supply and Distribution)Online Data USDA’s Economic Information System World Agricultural Outlook Board USDA/FAS/OGA/IPAD
USDA/FAS EconomicAnalysis USDA Publications USDA’s Economic Intelligence System • World Agricultural Supply & Demand Estimates (WASDE) released on the 9-12th day of each month at 8:30AM. • PSD Online stores current & historical crop estimates, imports, exports, consumption, and stocks. Chicago Board of Trade (CBOT) & other commodity markets • Trade Policy • Exporter Assistance & Export Programs • Food Aid & Export Credit Programs • UMR (Usual Marketing Requirements) • USDA decision-makers • U.S. Ag Producers & Traders • Commodity Price Discovery • Commodity Price Adjustments USDA/FAS/OGA/IPAD
USDA’s Economic Intelligence System Monthly crop estimates (grains, oilseeds, cotton) for each country (from 1960-current month) are available on the internet at: WASDE from WAOBhttp://www.usda.gov/oce/commodity/wasde/ PSD Online from FAS http://www.fas.usda.gov/psdonline/ Monthly World Production, Market and Trade Reports from FAS http://www.fas.usda.gov/currwmt.asp USDA/FAS/OGA/IPAD
WASDE Monitors Global Crop Production, Imports, Exports, Consumption, and Stocks Landsat-1 launched in July 23, 1972 and first WASDE (10/14/80) predecessor released on Sept. 17, 1973. USDA/FAS/OGA/IPAD
WASDE Monitors Global Crop Production, Imports, Exports, Consumption, and Stocks Production continues to grow in Asia USDA/FAS/OGA/IPAD
2010 Russia Drought Raised Prices but not to 2008 Levels Low Global Stocks Russia July/Aug 2010 drought raised wheat prices USDA/FAS/OGA/IPAD
Global Wheat Yields Spring wheat Winter wheat NorthernHemisphere where temperatures are cooler. Northern Hemisphere produces approximately 92% of global wheat Source: Monfreda, C., N. Ramankutty, and J.A. Foley. 2008. Farming the planet: 2. Geographic distribution of crop areas, yields, physiological types, and net primary production in the year 2000. Global Biogeochemical Cycles 22: GB1022 USDA/FAS/OGA/IPAD
Global Corn Yields ~300 MT Northern Hemisphere produces approximately 85% of global corn Source: Monfreda, C., N. Ramankutty, and J.A. Foley. 2008. Farming the planet: 2. Geographic distribution of crop areas, yields, physiological types, and net primary production in the year 2000. Global Biogeochemical Cycles 22: GB1022 USDA/FAS/OGA/IPAD
Global Warming Effects On Agriculture Episodic events such as record heat temperatures during July/August over major grain belts has the potential to increase prices as never seen before. Source: http://jrscience.wcp.muohio.edu/climatechange02/ProposalArticles/lkhgd.html USDA/FAS/OGA/IPAD
Winter and Spring Wheat Regions Spring wheat: Harvest in October Winter wheat: Harvest in June USDA/FAS/OGA/IPAD
Red columns indicate record output (1968 for spring wheat, 2008 for winter.) USDA/FAS/OGA/IPAD
Growing Season Total To Date USDA/FAS/OGA/IPAD
Damage Stress USDA/FAS/OGA/IPAD
Damage Stress USDA/FAS/OGA/IPAD
Damage Stress USDA/FAS/OGA/IPAD
D4 D4 D2 D4 D3 D4 D3 D4 D4: 1 in 50-100 Yr Drought D3: 1 in 20-50 Yr Drought D2: 1 in 10-20 Yr Drought D1: 1 in 5-10 Yr Drought August 12, 2010 USDA/FAS/OGA/IPAD
Ural District Central District Siberian District Volga District Kazakhstan Southern and North Caucasus Districts MODIS NDVI: Departure from Average, July 11-27, 2010 Below average vegetation health due to warm temperatures and drought. Satellite-derived vegetative indices indicate that crop conditions are significantly worse than normal in nearly every major crop-production region of Russia and Kazakhstan. Persistent drought and excessive heat have reduced yield prospects for all crops. USDA/FAS/OGA/IPAD
MODIS-NDVI indicate worst crop conditions in past ten years. (No analog year exists in the ten-year series.) Samara: MODIS NDVI Saratov: MODIS NDVI 95 90 2001 90 85 2002 2001 85 80 2003 2002 80 2004 2003 75 75 2005 2004 NDVI NDVI 70 2006 70 2005 65 2007 2006 65 60 2008 2007 60 2009 2008 55 55 2010 2009 50 50 2010 May 8 May 8 Apr 22 July 11 July 27 Apr 22 July 27 May 24 June 9 Aug 12 Aug 28 July 11 Aug 12 Aug 28 June 9 May 24 June 25 June 25 USDA/FAS/OGA/IPAD
Winter wheat production in 2010 did not drop to 25 MT as in 1998 USDA/FAS/OGA/IPAD
Summary Satellites Used by FAS/IPAD(time-series data sets important for crop monitoring) • Geo-stationary satellites monitor weather (rainfall & temperature) which is collected/processed by US Air Force Weather Agency (AFWA) • GOES (North & South America) • METEOSAT (Europe & Africa), and • GMS (Asia and Australia) • Polar-orbiting satellites to monitor: • NDVIand classify crops during growing season • NOAA-AVHRR (1-km and 8-km resolution), • SPOT-VEG ( 1-km resolution), • MODIS sensor on Terra/Aqua Satellites (250-meter resolution) • Landsat-7 (30-m) and AWiFS (56-m) on IRS • Soil moisture with passive microwave • Special Sensor Microwave Imager (SSM/I, 25-km) to measure surface wetness (good results in cloudy regions) • ASMR-e (1-km) to correct soil moisture water balance models • Radar satellite altimeters monitor lake water-level variations (10-day overpass) • TOPEX/Poseidon (1992-2002), Jason-1 (2002-2009), Jason-2 (Sept 2009-present) • ERS (1991-2001), ENVISAT (2001-present) USDA/FAS/OGA/IPAD
Crop Monitoring Heritage Crop Yield(AVHRR/MODIS/VIIRS) Crop Area(Landsat/AWiFS) • Free Landsat imagery greatly assists FAS to monitor global agriculture production. • Free Landsat imageryis USG’s gift to mankind for better understanding planet Earth. USDA/FAS/OGA/IPAD
Global Reservoir and Lake Monitor (GRLM) GRLM measures reservoir/lake height variations from 1992-present for 70+ lakes worldwide by utilizing satellite radar altimeters. Source: http://www.pecad.fas.usda.gov/cropexplorer/global_reservoir/ USDA/FAS/OGA/IPAD
1997/98 El Niño Impact on East Africa Lakes Lake Turkana Lake Victoria Lake Tanganyika Decrease in regional lake water levels after 1997/98 El Nino. http://www.pecad.fas.usda.gov/cropexplorer/global_reservoir/ USDA/FAS/OGA/IPAD
Timeline for Satellite Radar Altimetry • Recent Events: • June 20, 2008: Jason-2 or OSTM (Ocean Surface Topography Mission) launched and OSTM/Jason-2 data (i.e., time-series graphs and raw data) available from August 2008-present USDA/FAS/OGA/IPAD
Potential GRLM Improvements with ENVISAT Upcoming Event: September 2011: ENVISAT to monitor approximately 300 reservoirs and lakes USDA/FAS/OGA/IPAD
Recent Global Shortfalls Global stock/use ratios useful for monitoring global crop production shortages Global stocks near low levels of early-1970’s 2006-07 shortfall from two consecutive years of drought in major production regions Bumper harvest in 2008 restored stocks 2010/11 shortfall from consumption being greater than production Free markets work and producers will respond to increased prices by planting more area Bumper 2011 harvest for northern hemisphere required to restore low global stocks USDA/FAS/OGA/IPAD
Future Crop Production Shortfalls?? Unprecedented heat waves and mega-droughts (during July/August) could lead to unprecedented shocks to commodity markets. Location of future drought epicenters over major grain belts is a concern: US Midwest where ~300MT of corn is produced EU, Russia and China Grain Belts Future droughts may not have an “analog year” when compared to historic meteorological or NDVI records. Slide Disclaimer on Future Scenarios: Author’s opinion and not necessary official USDA policy USDA/FAS/OGA/IPAD
Thank you! USDA/FAS/OGA/IPAD