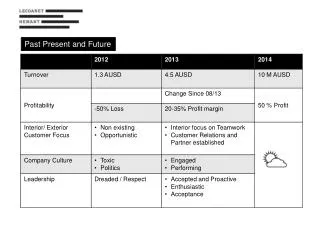
Mega Trends in Workers Compensation Past, Present and Future
1.01k likes | 1.25k Vues
Mega Trends in Workers Compensation Past, Present and Future. 16 th Annual AMCOMP Conference Las Vegas, NV March 27, 2014 Download at www.iii.org/presentations. Robert P. Hartwig, Ph.D., CPCU, President & Economist Insurance Information Institute 110 William Street New York, NY 10038

Mega Trends in Workers Compensation Past, Present and Future
E N D
Presentation Transcript
Mega Trends in Workers CompensationPast, Present and Future 16th Annual AMCOMP Conference Las Vegas, NV March 27, 2014 Download at www.iii.org/presentations Robert P. Hartwig, Ph.D., CPCU, President & Economist Insurance Information Institute 110 William Street New York, NY 10038 Tel: 212.346.5520 Cell: 917.453.1885 bobh@iii.org www.iii.org
Presentation Outline • The Post-Crisis Economy & Workers Compensation • The scars of the “Great Recession” are still visible on the WC line • The New American Labor Force • The Reindustrialization of America • The Future of Healthcare in the United States • WC’s future in inextricably linked to influences in this key sector • Workers Compensation Operating Result Update • Workers Compensation: The Next 100 Years • Q&A eSlide – P6466 – The Financial Crisis and the Future of the P/C
The Slow and Uneven Nature of the Economic Recovery Is Changing the WC Playing Field Despite a Still-Sluggish Economy, there Are Potent Growth Drivers for Workers Comp and Commercial Insurers in General 3
US Real GDP Growth* The Q4:2008 decline was the steepest since the Q1:1982 drop of 6.8% Real GDP Growth (%) Recession began in Dec. 2007. Economic toll of credit crunch, housing slump, labor market contraction was severe 2014/15 are expected to see a modest acceleration in growth Demand for Insurance Should Increase in 2014/15 as GDP Growth Accelerates Modestly and Gradually Benefits the Economy Broadly * Estimates/Forecasts from Blue Chip Economic Indicators. Source: US Department of Commerce, Blue Economic Indicators 3/14; Insurance Information Institute.
Real GDP by State Percent Change, 2012:Highest 25 States North Dakota was the economic growth juggernaut of the US in 2012—by far Only 10 states experienced growth in excess of 3%, which is what we would see nationally in a more typical recovery Sources: US Bureau of Labor Statistics; Insurance Information Institute.
Real GDP by State Percent Change, 2012: Lowest 25 States Growth rates in 8 states (and DC) were still below 1% in 2012 Connecticut was the only state to shrink in 2012 Sources: US Bureau of Labor Statistics; Insurance Information Institute.
Consumer Sentiment Survey (1966 = 100) January 2010 through March 2014 Optimism among consumers dropped in Q3 2013 as the government shutdown created uncertainty, then rebounded though the harsh winter took a toll Impact of 2011 budget impasse Consumer confidence has been low for years amid high unemployment, falling home prices and other factors adversely impact consumers, but improved substantially over the past 2+ years, though uncertainty in Washington sometimes takes a toll. Source: University of Michigan; Insurance Information Institute
New Private Housing Starts, 1990-2019F Job growth, low inventories of existing homes, low mortgage rates and demographics should continue to stimulate new home construction for several more years (Millions of Units) New home starts plunged 72% from 2005-2009; A net annual decline of 1.49 million units, lowest since records began in 1959 Insurers Are Continue to See Meaningful Exposure Growth in the Wake of the “Great Recession” Associated with Home Construction: Construction Risk Exposure, Surety, Commercial Auto; Potent Driver of Workers Comp Exposure Source: U.S. Department of Commerce; Blue Chip Economic Indicators (3/14 and 3/13); Insurance Information Institute.
Commercial & Industrial Loans Outstandingat FDIC-Insured Banks, Quarterly, 2006-2013* $Trillions In nominal dollar terms, this is an all-time high. Recession Outstanding loan volume has been growing for over two yearsand (as of year-end 2012) surpassed previous peak levels. *Latest data as of 2/2/2014. Source: FDIC at http://www2.fdic.gov/qbp/ (Loan Performance spreadsheet); Insurance Information Institute. eSlide – P6466 – The Financial Crisis and the Future of the P/C
ISM Non-Manufacturing Index (Values > 50 Indicate Expansion) January 2010 through February 2014 Optimism among non-manufacturers was hurt by the uncertainty in Washington, but remains resilient Non-manufacturing industries have been expanding and adding jobs. This trend is likely to continue through 2014. Source: Institute for Supply Management at http://www.ism.ws/ismreport/nonmfgrob.cfm; Insurance Information Institute.
Business Bankruptcy Filings,1980-2013 % Change Surrounding Recessions 1980-82 58.6% 1980-87 88.7% 1990-91 10.3% 2000-01 13.0% 2006-09 208.9% 2013 bankruptcies totaled 33,212, down 17.1% from 2012—the fourth consecutive year of decline. Business bankruptcies more than tripled during the financial crisis. Significant Exposure Implications for All Commercial Lines as Business Bankruptcies Begin to Decline Sources: American Bankruptcy Institute (1980-2012) at http://www.abiworld.org/AM/AMTemplate.cfm?Section=Home&TEMPLATE=/CM/ContentDisplay.cfm&CONTENTID=61633; 2013 data from United States Courts at http://news.uscourts.gov; Insurance Information Institute. 12 12/01/09 - 9pm eSlide – P6466 – The Financial Crisis and the Future of the P/C
Nonfarm Payroll (Wages and Salaries):Quarterly, 2005–2013:Q4 Billions Latest (2013:Q4) was $7.23 trillion, a new peak--$980B above 2009 trough Prior Peak was 2008:Q1 at $6.60 trillion Payrolls are 15.7% above their 2009 trough and up 2.0% over the past year Recent trough (2009:Q3) was $6.25 trillion, down 5.3% from prior peak Note: Recession indicated by gray shaded column. Data are seasonally adjusted annual rates. Sources: http://research.stlouisfed.org/fred2/series/WASCUR; National Bureau of Economic Research (recession dates); Insurance Information Institute. 13 12/01/09 - 9pm eSlide – P6466 – The Financial Crisis and the Future of the P/C
12 Industries for the Next 10 Years: Insurance Solutions Needed Health Care Health Sciences Energy (Traditional) Many industries are poised for growth, though insurers’ ability to capitalize on these industries varies widely Alternative Energy Petrochemical Agriculture Natural Resources Technology (incl. Biotechnology) Light Manufacturing Insourced Manufacturing Export-Oriented Industries Shipping (Rail, Marine, Trucking, Pipelines)
CONSTRUCTION INDUSTRY OVERVIEW & OUTLOOK The Construction Sector Is Critical to the Economy and the WC Insurers 15
Value of New Private Construction: Residential & Nonresidential, 2003-2013* 2013: Value of new pvt. construction hits $667.5B, up 33% from the 2010 trough but still 27% below 2006 peak New Construction peaks at $911.8. in 2006 Billions of Dollars Trough in 2010 at $500.6B, after plunging 55.1% ($411.2B) $15.0 $613.7 $311.5 $298.1 $261.8 $356.0 $238.8 Private Construction Activity Is Moving in a Positive Direction though Remains Well Below Pre-Crisis Peak; Residential Dominates *2013 figure is a seasonally adjusted annual rate as of December. Sources: US Department of Commerce; Insurance Information Institute. 16 12/01/09 - 9pm eSlide – P6466 – The Financial Crisis and the Future of the P/C
Value of Construction Put in Place, January 2014 vs. January 2013* Growth (%) Private: +12.3% Public: +2.5% Public sector construction activity remains low but is no longer contracting Private sector construction activity is now up in the residential and nonresidential segments Overall Construction Activity is Up, But Growth Is Almost Entirely in the Private Sector as State/Local Government Budget Woes Continue *seasonally adjustedSource: U.S. Census Bureau, http://www.census.gov/construction/c30/c30index.html ; Insurance Information Institute.
Value of Private Construction Put in Place, by Segment, Jan. 2014 vs. Jan. 2013* Led by the Residential Construction, Lodging, Communication and Office segments, Private sector construction activity is rising after plunging during the “Great Recession.” Growth (%) Private Construction Activity is Up in Most Segments, Including the Key Residential Construction Sector; Bodes Well for Early 2014 *seasonally adjustedSource: U.S. Census Bureau, http://www.census.gov/construction/c30/c30index.html ; Insurance Information Institute.
Private Construction by Segment/Project Type, Jan. 2014 vs. Jan. 2013* Shopping malls/centers and warehouse construction are among the strongest nonresidential segments Growth (%) Private Construction Activity is Up in Many Segments, Including the Key Residential Construction Sector, But Down in a Few *seasonally adjustedSource: U.S. Census Bureau, http://www.census.gov/construction/c30/c30index.html ; Insurance Information Institute.
Florida Total Private Housing Starts,2000 – 2017F (Thousands of Units) CRASH, CRATER, RECOVERY Homebuilding in FL continues to recover, but employment and WC exposures will take more than a decade to recover The economic outlook for most of the US is positive for the first time in many years Source: University of Central Florida Institute for Economic Competitiveness: http://iec.ucf.edu/post/2014/01/07/Florida-Metro-Forecast-December-2013.aspx
Value of New Federal, State and Local Government Construction: 2003-2013* Austerity Reigns Govt. construction is still shrinking, down $40.5B or 12.9% since 2009 peak Construction across all levels of government peaked at $314.9B in 2009 ($ Billions) Government Construction Spending Peaked in 2009, Helped by Stimulus Spending, but Continues to Contract As State/Local Governments Grapple with Deficits and Federal Sequestration Takes Hold *2013 figure is a seasonally adjusted annual rate as of December. Sources: US Department of Commerce; Insurance Information Institute. eSlide – P6466 – The Financial Crisis and the Future of the P/C
Value of Public Construction Put in Place, by Segment, Jan. 2014 vs. Jan. 2013* Highway, Transport, and Power projects lead public sector construction Public sector construction activity is down substantially in most segments, a situation that will likely persist, dragging on public entity risk exposures Growth (%) Public Construction Activity is Down in Many Segments as State and Local Budgets Remain Under Stress; Improvement Possible in 2014. *seasonally adjustedSource: U.S. Census Bureau, http://www.census.gov/construction/c30/c30index.html ; Insurance Information Institute.
Construction Employment,Jan. 2010—February 2014* (Thousands) Construction employment is +506,000 aboveJan. 2011 (+9.3%) trough Construction and manufacturing employment constitute 1/3 of all payroll exposure. *Seasonally adjusted. Sources: US Bureau of Labor Statistics at http://data.bls.gov; Insurance Information Institute. 25 12/01/09 - 9pm eSlide – P6466 – The Financial Crisis and the Future of the P/C
Construction Employment, Jan. 2003–February 2014 (Thousands) Construction employment as of Feb. 2014 totaled 5.941 million, an increase of 506,000 jobs or 9.3% from the Jan. 2011 trough Construction employment peaked at 7.726 million in April 2006 Construction employment troughed at 5.435 million in Jan. 2011, after a loss of 2.291 million jobs, a 29.7% plunge from the April 2006 peak The “Great Recession” and housing bust destroyed 2.3 million constructions jobs The Construction Sector Could Be a Growth Leader in 2014 as the Housing Market, Private Investment and Govt. Spending Recover. WC Insurers Will Benefit. Note: Recession indicated by gray shaded column. Sources: U.S. Bureau of Labor Statistics; Insurance Information Institute. 26 12/01/09 - 9pm eSlide – P6466 – The Financial Crisis and the Future of the P/C
The New American Labor Force The Recovery’s Winners and Losers Are Reshaping the Sources of WC’s Payroll Exposure Base 27
Unemployment and Underemployment Rates: Still Too High, But Falling January 2000 through February 2014, Seasonally Adjusted (%) U-6 went from 8.0% in March 2007 to 17.5% in October 2009; Stood at 12.6% in Feb. 2014.8% to 10% is “normal.” “Headline” unemployment was 6.7% in February 2014.4% to 6% is “normal.” As the unemployment rate approaches 6%, the Fed will begin signaling on short-term rates Stubbornly high unemployment and underemployment constrain overall economic growth, but the job market is now clearly improving. Source: US Bureau of Labor Statistics; Insurance Information Institute. 28 12/01/09 - 9pm eSlide – P6466 – The Financial Crisis and the Future of the P/C
US Unemployment Rate Forecast 2007:Q1 to 2015:Q4F* Rising unemployment eroded payrolls and WC’s exposure base. Unemployment peaked at 10% in late 2009. Jobless figures have been revised slightly downwards for 2014/15 Unemployment forecasts have been revised slightly downwards. Optimistic scenarios put the unemployment as low as 6.0% by Q4 of thisyear. * = actual; = forecasts Sources: US Bureau of Labor Statistics; Blue Chip Economic Indicators (3/14 edition); Insurance Information Institute.
Monthly Change in Private Employment January 2007 through February 2014 (Thousands, Seasonally Adjusted) 162,000 private sector jobs were created in February Jobs Created 2013: 2.368 Mill 2012: 2.294 Mill 2011: 2.400 Mill 2010: 1.277 Mill Monthly losses in Dec. 08–Mar. 09 were the largest in the post-WW II period Private Employers Added 8.34 million Jobs Since Jan. 2010 After Having Shed 5.01 Million Jobs in 2009 and 3.76 Million in 2008 (State and Local Governments Have Shed Hundreds of Thousands of Jobs) Source: US Bureau of Labor Statistics: http://www.bls.gov/ces/home.htm; Insurance Information Institute
Cumulative Change in Private Sector Employment: Jan. 2010—Feb. 2014 January 2010 through February 2014* (Millions) Job gains and pay increases have added nearly $1 trillion to payrolls since Jan. 2010 Cumulative job gains through Feb. 2014 totaled 8.64 million Private Employers Added 8.64 million Jobs Since Jan. 2010 After Having Shed 4.98 Million Jobs in 2009 and 3.80 Million in 2008 (State and Local Governments Have Shed Hundreds of Thousands of Jobs) Source: US Bureau of Labor Statistics: http://www.bls.gov/ces/home.htm; Insurance Information Institute
Cumulative Change in Government Employment: Jan. 2010—Dec. 2013 Government at all levels has shed more than 600,000 jobs since Jan. 2010 even as private employers created 8.14 million jobs, though losses may now be stabilizing. January 2010 through Dec. 2013* (Millions) Cumulative job losses through Dec. 2013 totaled 631,000 Temporary Census hiring distorted 2010 figures Governments at All Levels are Under Severe Fiscal Strain As Tax Receipts Plunged and Pension Obligations Soared During the Financial Crisis: Sequestration Will Add to this Toll Source: US Bureau of Labor Statistics http://www.bls.gov/data/#employment; Insurance Information Institute
Net Change in Government Employment: Jan. 2010—Dec. 2013* State government employment fell by 1.9% since the end of 2009 but is recovering while Federal employment is down by 3.8% and deteriorating (Thousands) Local government employment shrank by 424,000 from Jan. 2010 through Dec. 2013, accounting for 67% of all government job losses, negatively impacting WC exposures for those cities and counties that insure privately *Cumulative change from prior month; Base employment date is Dec. 2009. Source: US Bureau of Labor Statistics http://www.bls.gov/data/#employment; Insurance Information Institute eSlide – P6466 – The Financial Crisis and the Future of the P/C
Unemployment Rates by State, February 2014:Highest 25 States* In February, 29 states had over-the-month unemployment rate decreases, 10 states had increases, and 11 states and the District of Columbia had no change. *Provisional figures for February 2014, seasonally adjusted. Sources: US Bureau of Labor Statistics; Insurance Information Institute.
Unemployment Rates by State, February 2014: Lowest 25 States* In February, 29 states had over-the-month unemployment rate decreases, 10 states had increases, and 11 states and the District of Columbia had no change. *Provisional figures for February 2014, seasonally adjusted. Sources: US Bureau of Labor Statistics; Insurance Information Institute.
Payroll vs. Workers Comp Net Written Premiums, 1990-2013E Payroll Base* WC NWP $Billions $Billions 12/07-6/09 7/90-3/91 3/01-11/01 WC premium volume dropped two years before the recession began WC net premiums written were down $14B or 29.3% to $33.8B in 2010 after peaking at $47.8B in 2005 +8.5% in 2013E Continued Payroll Growth and Rate Increases Suggest WC NWP Will Grow Again in 2014; +8.6% Growth Estimated for 2013 *Private employment; Shaded areas indicate recessions. WC premiums for 2012 are I.I.I. estimate based YTD 2013 actuals. Sources: NBER (recessions); Federal Reserve Bank of St. Louis at http://research.stlouisfed.org/fred2/series/WASCUR ; NCCI; I.I.I.
Labor Force Participation Rate by Gender, 1948—2013 (Percent) 86.6% or working age men participated in the labor force in 1948 compared to 32.7% or women By 2013, the labor force participation rate for men had declined to 69.7% while the participation rate for women had risen to 57.2% By 2013, 57.2% of working age women participated in the labor force, up from 32.7% in 1948 but down from its all time high of 60.0% in 1999 Sources: U.S. Bureau of Labor Statistics;Insurance Information Institute. eSlide – P6466 – The Financial Crisis and the Future of the P/C
Labor Force Participation by Sex and Education through the Crisis: 2006, 2010 and 2013 Workers lacking a college degree suffer from much higher rates of unemployment Men were hit harder and continue to do worse than women in the job market. Women are likely to do better than men for the indefinite future. Unemployment Rate (%) The composition and character of the U.S. labor force is changing rapidly. Winners and losers have clearly emerged. What does this mean for WC? Sources: U.S. Bureau of Labor Statistics;Insurance Information Institute.
Unemployment Rates by Age and Race: 2006, 2010 and 2013 Unemployment among younger workers remains a chronic problem Unemployment among some minority groups remains far above pre-recession levels Unemployment Rate (%) Source: U.S. Bureau of Labor Statistics; Insurance Information Institute.
Labor Force Participation Rate, Ages 65-69, Quarterly, 1998:Q1-2013:Q2 Labor Force participation rate 1 in 3 in this age group are working. Virtually none of them are “baby boomers” The brown bars indicate recessions. The labor force participation rate for workers 65-69 might grow even faster in the future as seniors find they can’t fully retire on their meager retirement savings. Not seasonally adjusted. Sources: US Bureau of Labor Statistics, US Department of Labor; Insurance Information Institute.
Labor Force Participation Rate,Ages 70-74, Quarterly, 1998:Q1-2013:Q2 Labor Force participation rate Nearly 1 in 5 in this age group is working.A dozen years ago it was 1 in 8. The labor force participation rate for workers 70-74 grew by about 50% since 1998.Growth stalled during and after the Great Recession but has since resumed. Source: US Bureau of Labor Statistics, US Department of Labor; Insurance Information Institute.
The Reindustrialization of America American Industrial Might Is Making a Comeback A Golden Opportunity for Workers Comp Insurers? 50
Dollar Value* of Manufacturers’ Shipments Monthly, Jan. 1992—Dec. 2013 $ Millions The value of Manufacturing Shipments in Dec. 2013 was $492.7B—a near record high. Monthly shipments in Dec. 2013 exceeded the pre-crisis (July 2008) peak. Manufacturing is energy-intensive and growth leads to gains in many commercial exposures: WC, Commercial Auto, Marine, Property, and various Liability Coverages. *seasonally adjusted; Dec. 2013 is preliminary; data published February 4, 2014.Source: U.S. Census Bureau, Full Report on Manufacturers’ Shipments, Inventories, and Orders, http://www.census.gov/manufacturing/m3/ 51 12/01/09 - 9pm eSlide – P6466 – The Financial Crisis and the Future of the P/C
ISM Manufacturing Index (Values > 50 Indicate Expansion) January 2010 through February 2014 Manufacturing continued to expand in early 2014 The manufacturing sector expanded for 48 of the 50 months from Jan. 2010 through February 2014. Weakness in early 2014 stems largely from harsh winter weather and weakness in China. Source: Institute for Supply Management at http://www.ism.ws/ismreport/mfgrob.cfm; Insurance Information Institute.
Manufacturing Growth for Selected Sectors, 2013 vs. 2012* Growth (%) Non-Durables: +0.2% Durables: +3.4% Manufacturing of durable goods was especially strong in 2012 but weakened in 2013 Manufacturing Is Expanding—Albeit Slowly—Across a Number of Sectors that Will Contribute to Growth in Insurable Exposures Including: WC, Commercial Property, Commercial Auto and Many Liability Coverages *Seasonally adjusted; Date are YTD comparing data through November 2013 to the same period in 2012.Source: U.S. Census Bureau, Full Report on Manufacturers’ Shipments, Inventories, and Orders, http://www.census.gov/manufacturing/m3/
Durable Manufacturing: New Order Growth and Shipments, 2013 Most manufacturing sectors indicate order growth outstripping shipments, a favorable indicator for investment and expansion Growth (%) Manufacturing Is Expanding: New orders exceed shipments which suggests the industry is in an expansionary phase *Seasonally adjusted; Date are advance report YTD data comparing data through December 2013 to the same period in 2012.Source: U.S. Census Bureau, Full Report on Manufacturers’ Shipments, Inventories, and Orders, http://www.census.gov/manufacturing/m3/
Recovery in Capacity Utilization is a Positive Sign for Commercial Exposures March 2001 through December 2013 “Full Capacity” The US operated at 79.2% of industrial capacity in Dec. 2013, well above the June 2009 low of 66.9% but is still below pre-recession levels. Percent of Industrial Capacity Hurricane Katrina The closer the economy is to operating at “full capacity,” the greater the inflationary pressure March 2001-November 2001 recession December 2007-June 2009 Recession 55 Source: Federal Reserve Board statistical releases at http://www.federalreserve.gov/releases/g17/Current/default.htm.
Manufacturing Employment,Jan. 2010—February 2014* (Thousands) Since Jan 2010, manufacturing employment is up (+605,000 or +5.3%)and still growing. Manufacturing employment is a surprising source of strength in the economy. Employment in the sector is at a multi-year high. *Seasonally adjusted; Jan. and Feb. 2014 are preliminary Sources: US Bureau of Labor Statistics at http://data.bls.gov; Insurance Information Institute. 56 12/01/09 - 9pm eSlide – P6466 – The Financial Crisis and the Future of the P/C
Business Investment: Expected to Accelerate, Fueling Commercial Exposure Growth Accelerating business investment will be a potent driver of commercial property and liability insurance exposures and should drive employment and WC payroll exposures as well (with a lag) Source: IHS Global Insights as of Jan. 13, 2014; Insurance Information Institute.
U.S. Natural Has Imports and Exports, 1990 - 2040 Trillions of Cubic Feet The US is now the largest gas producer in the world, though Russia is the largest exporter. The US needs to invest in its pipeline and LNG infrastructure and expedite regulatory approval to realize its full export potential Sources: US Energy Information Administration, Annual Energy Outlook 2014 Early Release Overview; ;Insurance Information Institute.
Oil & Gas Extraction Employment,Jan. 2010—Feb. 2014* Highest since Aug. 1986 Oil and gas extraction employment is up 32.9% since Jan. 2010 as the energy sector booms. Domestic energy production is essential to any robust economic recovery in the US. (Thousands) *Seasonally adjusted Sources: US Bureau of Labor Statistics at http://data.bls.gov; Insurance Information Institute. 59 12/01/09 - 9pm eSlide – P6466 – The Financial Crisis and the Future of the P/C
Growth in Health Professions,1991-2013 (Percent Annual Change) Average Annual Growth Average Healthcare: 2.5% Total Nonfarm: 1.0% The U.S. economy lost more than 8 million jobs during the Great Recession, but health sector employment expanded Healthcare employment has continued to grow in good times and bad - including the Great Recession. Sources: Bureau of Labor Statistics, Insurance Information Institute. 60
Occupations Ranked by Projected Percentage Growth, 2012-2022F (Millions) Healthcare professions are expected to grow at 2 to nearly 3 times employment growth overall Source: Bureau of Labor Statistics, Insurance Information Institute.