Download
1 / 19
190 likes | 314 Vues
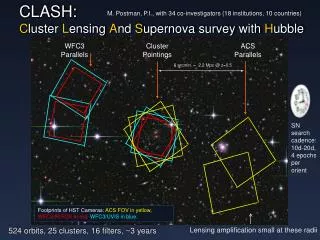
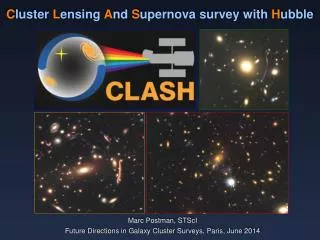
C luster L ensing A nd S upernova survey with H ubble. Marc Postman, STScI Future Directions in Galaxy Cluster Surveys, Paris, June 2014. The CLASH Science Team:. Ofer Lahav Ruth Lazkoz Doron Lemze Dan Maoz Curtis McCully Elinor Medezinski Peter Melchior Massimo Meneghetti

E N D
Cluster Lensing And Supernova survey with Hubble Marc Postman, STScI Future Directions in Galaxy Cluster Surveys, Paris, June 2014
The CLASH Science Team: OferLahav Ruth Lazkoz DoronLemze Dan Maoz Curtis McCully Elinor Medezinski Peter Melchior Massimo Meneghetti AmataMercurio Julian Merten Anna Monna Alberto Molino John Moustakas Leonidas Moustakas Mario Nonimo Brandon Patel Adam Riess Steve Rodney PieroRosati Jack Sayers Irene Sendra Stella Seitz Seth Siegel RenskeSmit Leonardo Ubeda Keiichi Umetsu Arjen van der Wel BingxiaoXu Wei Zheng Bodo Ziegler Adi Zitrin UCL Univ. of the Basque Country JHU Tel Aviv University Rutgers University JHU The Ohio State University INAF / OsservatorioAstronomico di Bologna INAF / OAC JPL / Caltech Univ. SternwarteMunchen / MPE IAA Siena College JPL / Caltech INAF / OsservatorioAstronomico di Bologna Rutgers University STScI / JHU JHU European Southern Observatory Caltech Univ of Basque Country UniversitasSternwarteMünchen Caltech Leiden University STScI Academia Sinica, Institute of Astronomy & Astrophysics Max Planck InstitütfürAstronomie JHU JHU UniversitätWein Caltech Marc Postman, P.I. BegonaAscaso ItaloBalestra Matthias Bartelmann Narciso “Txitxo” Benitez Andrea Biviano Rychard Bouwens Larry Bradley Thomas Broadhurst Dan Coe Thomas Connor Mauricio Carrasco Nicole Czakon Megan Donahue Kevin Fogarty Holland Ford Jorge Gonzalez Or Graur Genevieve Graves Øle Host Claudio Grillo Sunil Golwala Aaron Hoffer LeopoldoInfante SaurubhJha Yolanda Jimenez-Teja StéphanieJouvel Daniel Kelson Anton Koekemoer UlrickeKuchner Space Telescope Science Institute (STScI) UC Davis Max Plank Institute (MPE) UniversitätHeidelberg Instituto de Astrofisica de Andalucia (IAA) INAF - OATS Leiden University STScI Univ. of the Basque Country STScI Michigan State University Universidad Catolica de Chile California Institute of Technology / ASIAA Michigan State University Johns Hopkins University (JHU) JHU Universidad Catolica de Chile JHU University of California, Berkeley DARK Cosmology Centre DARK Cosmology Centre California Institute of Technology (Caltech) Michigan State University Universidad Católica de Chile Rutgers University IAA Univ. College London (UCL) / Barcelona Carnegie Institute of Washington STScI UniversitätWein Post-doctoral fellow Graduate student
How is Matter Distributed in Cluster & Galaxy Halos? 130 Mpc • How centrally concentrated is the DM? Implications for epoch of formation. • What degree of substructure exists? And on what scales? • How well do DM profiles match those predicted from simulations? • What correlations exist between the distribution of baryonic matter and DM? • What can we learn about the properties of DM itself? 12.5 Gyr “Millennium” simulation of DM Springel et al. 2005
Comprehensive Multi-wavelength Coverage • HST: 25 clusters, each imaged in 16 passbands (0.23 – 1.6 μm) ~20 orbits per cluster. HST is survey complete. • Photo-z accuracy achieved: 0.03 * (1 + z) • Subaru wide-field imaging (0.4 – 0.9 μm) • Chandra x-ray Observatory archival data (0.5 – 7 keV) and XMM data. • Spitzer Space Telescope archival and new cycle 8 data (3.6, 4.5 μm) • SZE observations (Bolocam, Mustang) to augment existing data (sub-mm) • VLT, LBT, Magellan, MMT, Palomar Spectroscopy (~30,000 spectra to date)
MACS 0416-2403 Abell 2261 Abell 209 Abell 383 Abell 611 Abell 1423 MACS 0647+7015 MACS 0744+3927 MACS 1115+0129 MACS 0329-0211 MACS 0429-0253 MACS 1206-0847 MACS 0717+3745 CLJ1226+3332 RXJ 1532+3020 MACS 1311-0310 RXJ 1347-1145 MACS 1423+2404 MACS 1149+2223 RXJ 1720+3536 MACS 1931-2634 RXJ 2129+0005 MS-2137 RXJ 2248-4431 X-ray images of the 25 CLASH clusters. 20 are selected to be “relaxed” clusters (based on their x-ray properties only). 5 (last column) are selected specifically because they are strongly lensing θE > 35”. All CLASH clusters have Tx > 5 keV. MACS 2129-0741
CLASH HST Imaging Abell 611 (z = 0.288) 30 arcsec
CLASH HST Imaging MACS J1931-2634 (z = 0.352) 15arcsec
Pre-CLASH: Well constrained cluster mass profiles (from lensing) were more concentrated than simulated clusters c-M relation is a direct test of CDM paradigm as it predicts a strong correlation between the two. Observational studies of clusters with well constrained mass profiles yielded concentrations that were in tension with predictions. Partially explained by significant (50-100%) lensing selection bias as estimated by Hennawi07, Oguri09, Meneghetti10,11 – Broadhurst08, Oguri09, Sereno10, Zitrin11a,b Umetsu11 Oguri09 50% lensing bias?
Possible explanations for high observed concentrations • Lensing selection bias (Henawi+07, Oguri+09, Meneghetti+10,11) • Significant (25-50%) but is it sufficient? • 20 CLASH clusters are x-ray selected (minimal lensing bias) • Baryons and adiabatic contraction • Probably not a major (<10%) effect in clusters (Duffy+10, Mead+10, Fedeli11) … but needs to be checked. • Halo fitting procedure in simulations • Hennawi+07 find ~30%+ higher concentrations • Halo Triaxiality and LSS • Clusters formed sooner than in simulations • Early Dark Energy (Fedeli & Bartelmann07, Sadeh & Rephaeli08, Francis+09, Grossi & Springel09) • Few percent EDE at z~10 has impact.
Fully non-parametric approach (Merten+ 2009) • No assumption that light traces mass • Adaptive mesh reconstructionWL: Subaru/HST shear measurementsSL: Multiple image positions and redshiftsCan be extended to include other constraints • Spans at least 3 orders of magnitude in spatial range (~20 kpc to ~5 Mpc) • Method has proven reliability with numerical simulations. SaWLens Mass Reconstruction Meneghetti, Rasia, Merten et al. 2010
Dynamical analysis (Biviano et al. 2013) MACS1206 (z=0.45) Total mass profile from completely independent methods WL convergence (Umetsu et al. 2012)
Measuring the DM Equation of State Parameter, w(r): where pr(r) and pt(r) are the radial and tangential DM pressure profiles and ρ(r) is the density. Since baryons contribute at most 15% to the total mass in clusters and their pressure is negligible, the EoS parameter we derive describes the behavior of the DM fluid. The result here is currently the most stringent constraint on the DM EoS parameter. DM in clusters is indeed consistent with a pressureless fluid. Radially averaged value: w = 0.00 ± 0.15 (stat) ± 0.08 (syst) Sartoris et al. 2014 Above: The constraints on the EoS parameter, w(r), using different assumptions about the total mass and orbital velocity distributions.
CLASH Mass-Concentration Relation Bhatta+13 are from Multi-DARK simulations Ratio of Data to Model Conc. 1.13 ± 0.16 (p=0.99) 1.11 ± 0.21 (p=0.89) Merten et al. 2014
CLASH Mass-Concentration Relation Meneghetti+14 are from Multi-DARK simulations + more gas physics Ratio of Data to Model Conc. 0.96 ± 0.18 (p=0.80) Tension between previous data and predictions largely a sample selection effect. CLASH M-c relation, for M>4x10¹⁴, is fully consistent with LCDM. Merten et al. 2014
CLASH WL Masses Agree With WL Masses from the “Weighing The Giants” Project (von der Linden et al. 2014) Umetsu+ 2014
Donahue et al. 2014 (submitted; see arXiv: 1405.7876) Calibrating X-ray Mass Profiles Median Weighted Mean Chandra CLASH Israel+14: MChandra/MWL Mgas(XMM) / Mgas(Chandra) XMM CLASH 0.0 0.2 0.4 0.6 0.8 1.0 R (Mpc) von der Linden+14: MPlanck/MWL 1.4 HSE = Hydrostatic Equilibrium • CLASH X-ray HSE mass/Lensing mass ratios exhibit a radially dependent, systematic difference between our XMM and Chandra analyses. • Chandra and XMM electron density and gas mass estimates are consistent with each other. However, XMM Tx declines relative to Chandra Tx as radius increases beyond ~300 kpc. One plausible explanation may be large-angle scattering of soft X-ray photons beyond what is included in our treatment of the XMM PSF. • Generally expect HSE/WL mass ratio to be < 1 (some non-thermal support, turbulence, bulk motion, etc.). But the difference between XMM and Chandra cannot be astrophysical in nature since the above results are for the SAME clusters over the same radial range. • These results have implications for resolving the discrepancy between Planck cluster counts and CMB cosmological constraints. Currently working with Planck team on this topic.
Independent constraint on the nature of DM • WDM particle mass mX > 1.0 (0.9) keV at 68% (95%) • Limit depends only on WDM halo mass function, not on astrophysical modeling. Pacucci+13: “Even a few galaxies found in such small volumes require a very high number density of collapsed dark matter (DM) haloes. This implies significant primordial power on small scales, allowing these observations to rule out popular alternatives to standard cold dark matter (CDM) models, such as warm dark matter (WDM).” (too much small scale power) CLASH 2013 z > 9 galaxy candidates Pacucci et al. 2013, MNRAS, 435, 53.
Using SNe to Check SL Mass Models See Patel et al. 2014 and Nordin et al. 2014 CLO12Car SN z = 1.28 Hubble Diagram with SN CLO12Car shown relative to 18 field SN in similar redshift range. MACS1720+35 Lens Model Prediction CLN12Did SN z = 0.85 Lens Model Prediction RXJ1532+30 CLA11Tib SN z = 1.14 Abell 383 Values given in magnitudes
Summary of CLASH Results • CLASH discovering up to 10x as many multiple images as previously known, even in well studied systems. All with reliable photo-z. Enables precise SL mass profile shape measurements. • Excellent consistency between WL and SL and kinematic mass profiles in range where they overlap. • CLASH finds that x-ray selected clusters follow a mass-concentration relation that is consistent with predictions from LCDM N-body simulations. No tension remains between the data and the predictions at the high mass end (M > 4 x 10¹⁴). • HSE mass bias (relative to WL): XMM HSE bias has significant radial dependence, with b ≥ 0.25 at 1 Mpc; Chandra flat with b ~ ± 0.11. • New independent constraints on WDM particle mass and DM EoS (pressureless DM is consistent with observational constraints). • The HST survey is complete but CLASH results continue to flow. Co-added HST and Subaru images and lens models are available at the STScI MAST website. CLASH Spitzer data available at IRSA / IPAC.