Download
1 / 29
290 likes | 513 Vues
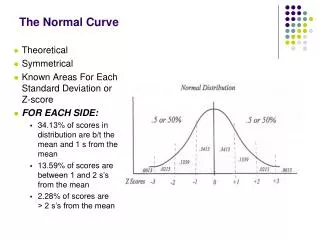
The Heating Curve. Mr. Shields Regents Chemistry U07 L03. Phase Changes. Let’s review what we’ve learned previously about PHASE CHANGES. First … What is a phase change? A change from one state of matter to another. What does endothermic and exothermic mean? Absorbs heat.

E N D
The Heating Curve Mr. Shields Regents Chemistry U07 L03
Phase Changes Let’s review what we’ve learned previously about PHASE CHANGES. First … What is a phase change? A change from one state of matter to another. What does endothermic and exothermic mean? Absorbs heat / Releases heat
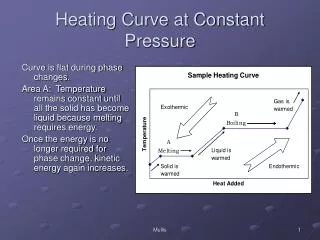
Gas Exothermic e c Energy Released Energy Absorbed Liquid a d f b Endothermic Solid Phase Change Overview What are the names of the phase changes we’ve studied? ENDOTHERMIC Phase changes EXOTHERMIC Phase Chages a. Sublimation d. Deposition b. Fusion e. Condensation c. Vaporization f. Solidification
Phase Changes What actually happens to E as matter moves from Solid Liquid Gas: Energy is absorbed (endo) Temp increases KE increases molecules move further apart PE increases (Why?) Remember … PE is a function of the position of two bodies relative to one another So … PE inc as molecular separation increases
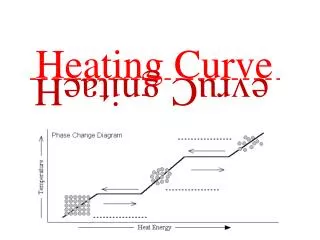
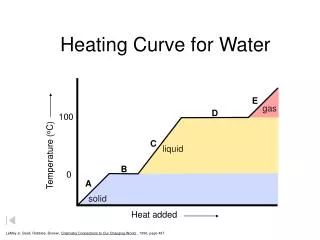
Heating Curve What happens when we keep adding energy to a solid ? Solid becomes a liquid then the liquid becomes a gas As this energy is added KE inc and so does Temp. but does temp Uniformly inc. over time? The answer is NO!
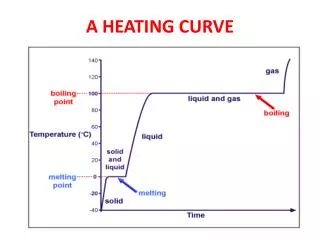
Heating Curve So what does happen if the temperature does not Uniformly increase? What happens is described by what is called the HEATING CURVE
Heating Curve If we heat a solid it’s temperature increases Steadily until we finally reach the temperature at which the solid begins to melt It begins to go thru a phase change solid Liquid This phase change is called fusion
Melting Solid Solid Solid/Liquid Phase Transition As the solid begins to melt something Unusual Happens. As we continue to add heat to the solid the temperature stops rising as the solid continues to melt. But why does this happen?
Solid/Liquid Phase Transition Solids exist in a rigid, closely packed, highly structured pattern Liquids however have no such rigid structure. As we reach the solids m.p. there is just enough energy to begin overcoming the intermolecular forces between molecules holding them together in the solid state... Molecules begin to separate
Heat of Fusion Added additional heat energy goes into Separating more and more molecules As molecules move from solid to liquid the PE Increases but since the temperature doesn’t rise The KE remains constant. The energy necessary to melt 1 GRAM of a solid is called the … It is unique for every substance. For water, the heat of fusion = 334 Joules/gram HEAT OF FUSION (Hf)
Solid/Liquid Phase transition Remember… heat ALWAYS flows from hot to cold Until the last piece of solid melts the temperature the Solid/liquid mixture remains constant Any excess heat in the liquid immediately flows back into the colder solid Once there’s no solid left all additional heat added begins to increase the temperature of the liquid. H C
Liquid S & L Solid Heating curve Solid/Liquid Phase transition When heat is added what happens to KE, T & PE ? Only a single solid (s) phase present KE (T) increases PE is Constant Dual L/S Phase present KE (T) is Constant PE increase Only a single liquid (l) phase present KE (T) increases PE is constant
B.P 0 Liquid S & L Solid Liquid/Vapor Phase transition Any additional heat added To the liquid inc. Temp. and Vapor Pressure. Once VP = Patm the liquid Boils. As in the transition from solid To liquid, 2 phases are now present & the Temp. of the boiling water remains constant
L & G Gas Liquid S & L Solid Heat of Vaporization Molecules in the liquid phase form a close but loosely organized structure Molecules in the gas Phase have no structure And are widely separated. To separate these molecules this much takes lots of energy. This energy is called the HEAT OF VAPORIZATION (Hv)
The Heating Curve Liquid & gas B.P. Solid & liquid M.P Heat of Vaporization For water, Hv = 2,260 Joules/g Note Hv > Hf As long as the liquid is boiling T and KE will be Constant PE will Increase as molecules Move further apart In the gas phase
Hv = 2,260 J/g (b.p.) T const. / KE const. /PE inc ( 2 phases ) T inc. / KE inc / PE Const. ( 1 phase ) Hf = 334 J/g (m.p.) Summary
A Review: Specific Heat Recall from our earlier discussions that … The SPECIFIC HEAT of a substance is the amount of heat required to raise the temperature of 1 g of the material by 1 degree centigrade. Each substance has it’s own unique specific heat… The lower the specific heat the better the conductor And …. q = Cp x m x (Tf – Ti)
Specific Heat One of the variables in Specific heat calculations Involves Temperature Change. What phases of the The heating curve Involve changes in T? Phase 1, 3, 5 The Heating Curve Phase V Phase III Phase IV Phase 1 Phase II
The Heating Curve Phase V Phase III Phase IV Phase 1 Phase II Specific Heat It’s in these phases that specific heat calculations are used to determine how much heat us needed to raise the temperature of the sample But how do we find the heat necessary to to fully melt or vaporize a sample of matter In regions where T does Not change (phase II & IV)
The Heating Curve Phase V Phase III Phase IV Phase 1 Phase II Melting/Vaporization Calculations It’s even easier than specific heat calculations since Temperature is not a variable. In phase II: Q= m x Hf m=total mass Hf=heat of fusion In phase IV: Q=m x Hv
The Heating Curve Phase V Phase III Phase IV Phase 1 Phase II Melting/Vaporization Calculations Problem 1: How much heat is necessary to melt 100g of ice? Problem 2: How much heat is necessary to vaporize this water? Q = m x Hf Q = 100g x 334 J/g Q = 33,400 J Q = m x Hv Q = 100g x 2,260 J/g Q = 226,000 J
Melting/Vaporization Calculations Note that these calculations are true for all sorts of matter, not just water. For example here are some Hvas a function of the intermolecular force: H2O Hydrogen Bonding 2260 J/g NH3 Hydrogen Bonding 1276 J/g H2S Dipole-Dipole 553 J/g F2 London Dispersion 155 J/g
Melting/Vaporization Calculations Problem: What is the heat of vaporization of a liquid if it takes 6500 J to totally vaporize 8g? Q = m x Hv 6500 J = 8g x Hv Hv = 6500 / 8 = 812.5 J/g
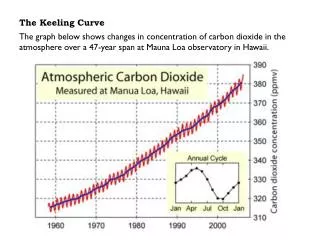
Heat of Fusion and Vaporization from heating graphs If heat is added at a constant rate over time to a specific mass we can determine both Hf and Hv by noting both the initial onset of melting or vaporization and the completion point.
875 KJ 3,100 KJ Heat of Fusion and Vaporization from heating graphs For example in this graph the onset of vaporization occurs after 875 Joules have been added and is complete after 3100 J have been added. Therefore It took 3100-875 KJ to Vaporize this sample. If the mass of the Sample is 300g then the Hv = 2225KJ/300g =7.417 KJ/g The same can be done To calculate the Hf
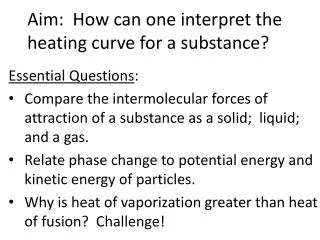
Time = 3.8min Time = 14.5 min 1 2 3 4 5 10 11 12 13 14 Time (min) Heat of Fusion and Vaporization from heating graphs If we add heat to a sample at a fixed rate, say 422.4 J/min, we Can then calculate both Hf and Hv if we know the mass Of the sample. In this example the water starts to boil at 3.8 min And is complete at 14.5 min So we’ve added 422.4J/min For 10.7min = 4520 J Since the mass is 2 gram then Hv. = 4520/2 = 2260 J (Mass = 2 gram)
Cooling Curve The opposite of a heating Curve is a COOLING CURVE. Brrrrr… Since the sample is cooling it must be releasing heat. As Temp decreases KE dec and as a sample goes from gas To liquid to solid the PE must be decreasing. Instead of Heat of vaporization and heat of fusion we have the Heat of condensation and the Heat of solidification. They Are equal to Hv and Hf but are opposite in value -Hv = Hc & -Hf = Hs
Gas Gas & Liquid I II III IV V Liquid Condensation Liquid & solid solid Solidification Cooling Curve Phase I: T dec KE dec PE constant Phase II: T constant KE constant PE dec Hc = -Hv Phase III: T dec KE dec PE constant Phase IV: T constant KE constant PE dec Hs = -Hf Phase V: same as I and III Note: This is the mirror image of a heating curve
Cooling Curve Calculations Problem: How much heat is released when 100g Of water solidifies? How much heat is released when 100g of water condenses? a) Q = m x Hs (i.e. –Hf ) Q = 100g x -334 J/g Q = -33,400 J (i.e. 33,400 joules are released) b) Q = 100g x -2260 J/g = -226,000 J The negative sign means this much heat is released (and not absorbed)