Download
1 / 24
240 likes | 262 Vues
Basic MeHg Mass Budget. Don Yee CFWG July 2008 Meeting. Problem Statement. MeHg very small % of totHg Poor MeHg:totHg correlation in SF Bay MeHg bioaccumulative form Do Bay MeHg data make sense given… Loading estimates Production, degradation rates Sediment-water exchange?. Objective(s).

E N D
Basic MeHg Mass Budget Don Yee CFWG July 2008 Meeting
Problem Statement • MeHg very small % of totHg • Poor MeHg:totHg correlation in SF Bay • MeHg bioaccumulative form • Do Bay MeHg data make sense given… • Loading estimates • Production, degradation rates • Sediment-water exchange?
Objective(s) • First order attempt to model MeHg • Synthesize state of knowledge • Identify key factors affecting MeHg fate • Evaluate need to better estimate MeHg load • Feasibility/needs of refined model(s) • Desired input • ID major weaknesses, alternative approaches and assumptions
Approach • Synthesizing existing data: • Ambient Bay data from RMP S&T • Loading data from local (RMP SPL) studies where possible, literature where not • MeHg production/degradation rates from local studies where possible • Simple simulation of sediment-water processes using 1-box model
1 Box Model • Adapted from PCB 1 box (2 box?) model • One water box • One sediment box (5cm mixed layer) • Daily time step • Annually uniform (no seasonality) • Daily uniform mixing (to 5cm in sediment) • Equilibrium partitioning • Simplifications ~work for POPs • ? Will it work for MeHg ?
External Loads (Imports) • Direct atmospheric (wet) deposition • Water Discharges from • Delta • Local watersheds • Wetlands • POTWs
Atmospheric (wet) Deposition • Literature rainfall MeHg (avg 0.11 ng/L) … • Watras & Bloom (1989 Olympic Penins. WA 0.15ng/L) • Risch et al (2001-2003 Indiana, 0.06ng/L) • St Louis et al (1995, ELA area, 0.05ng/L) • Mason et al (1997, Still Pond, MD, HgT x %MeHg avg = 0.04ng/L) • x Local annual precipitation (0.45m/y) • = 0.10 g/d deposition Baywide
Discharges from… • Delta (SWRCB Region 5) Hg TMDL • Flow weighted avg concentration x mean annual discharge (4.7g/d) • Local watersheds • SIMPLE Model urban totHg flux, assume constant %MeHg = 2.7g/d • %MeHg from lit median →1.1g/d • from local watershed Hayward Z4LA→ 4.1g/d
Discharges from… • Wetlands • Audobon est. 40k acres wetland (1.6e8 m2), assume 0.3m overlying water every day • ~50% water particulate settles -1.2g/d • ebb tide dissolved conc ~2.5x flood tide (max 5x Petaluma) +3.2g/d • = net 2g/d discharge to Bay • Stephenson et al showed net import and export different events for single marsh • May be difficult to refine net load
Discharges from… • POTWs • Annual mean conc x discharge for 16 largest plants (loads for each plant calculated then summed) = 0.79g/d • Conc range 0.04-1.3ng/L (mean ~0.42ng/L) • Discharge 14-165e9 L/y (sum ~2.15e9g/d)
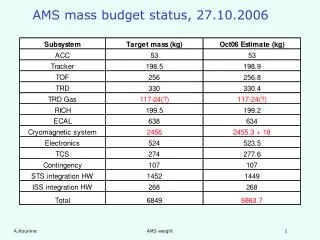
Loads (Imports) • 0.10g/d atmospheric (wet) deposition • 4.7g/d Delta • 2.7g/d Local watersheds • 2.0g/d Wetlands • 0.79g/d POTWs ~10.4g/d total MeHg load (3.78kg/y) • Other “loads” • MeHg production = internal source • Biouptake = “export” from water/sed exch.
MeHg Production • Unlike totHg & others, MeHg created in situ • Complex (non-linear) function of multiple factors- • C (not all C available), S(generally not limiting in estuary), Hg (poor regression for SF Bay) • Current best guess from range of production rates in lab incubation? • Marvin-DiPasquale et al 0.11ng/g·d (geomean of San Pablo, range 0.03-1.04) • Would otherwise need complex C & S mass balance/speciation & porewater redox model • Assume ½ of mixed sediment layer methylates
Biouptake “Loss” • Phytoplankton? • Cloern 2002-2004 productivity ~210gC/m2y • Hammerschmidt MeHg 0.5ng/g ww =5ng/g dw • LakeMichMassBal phyto MeHg = 30 ppb dw • C→CH2O, geomean MeHg 12ng/g • = 19.5g/d MeHg into phytoplankton • Phytoplankton rapid turnover (µ~0.3/d?), reversible “loss” from water/sed pools, loss estimate probably too high
Biouptake “Loss” • Small fish? • Slater (CDFG, IEP) young of year pelagic fish est. 0.01-0.25g/m3 (Suisun lowest, Central highest, mostly anchovies) mean ~0.17g/m3 ww biomass • RMP anchovy Hg 0.049µg/g ww = 0.13g/day MeHg into fish biomass (<1% of phyto?) • Expect less (short term) cycling than algae, “irreversible” net loss by incorporation into higher trophic levels
Other Processes • Modeled (dependent on MeHg conc) • Volatilization • Outflow (through Golden Gate) • De/sorption • Sedimentation • Benthic flux • Degradation
Modeled Processes • Volatilization- • Henry’s Law const for MeHgCl = 0.05 Pa·m3/mol (Lindqvist & Rodhe 1985) • Outflow (through Golden Gate) • Tidal mixing from Connelly, assume ocean MeHg ~MDL, min of Bay, or 0 • De/sorption • Bay water particulate vs dissolved log Kd=4.1 (could instead use porewater (Choe et al 2004) mean log Kd=4.66)
Modeled Processes • Sedimentation • Fuller burial rate (0.88cm/y) • Could be modeled as erosion • Benthic flux • Captured in daily resuspension and de/sorption? • Degradation • Marvin-DiPasquale San Pablo Bay geomean sed demethylation rates = 0.083/d (first order decay) • Krabbenhoft Petaluma wetland water half life~7 days (0.10/d decay) • Large uncertainties some parameters, but ~no effect
Base Case Run • Averaged initial concentrations, parameters • Equilibrium reached quickly, ~10-20% diff from T0 • Sed mass up • Water mass down • (adjust Kd? Relative degradation rates?)
Base Case Run • Mass (inventory) vs daily flux/degrade/produce • Water Mass • Net sediment to water exchange, ext load = Degradation>, GG outflow, >> biouptake,volatilization • Total (Water+Sed) • Production ~balances degradation >> all other processes *from 1box model, Choe et al flux box ~14g/day
Deep Mix Case Run • Mixed depth to 15cm • Methylation zone still set to ½ mixed depth • Equilibrium reached quickly, ~10-20% diff from T0 • Change only in sediment mass
2 Parameter Changes • S&W very sensitive to methylation rate, S deg rate • W Moderately sensitive to load, W deg rate • Kd has small effect (particulate, dissolved offset?)
Summary • Base case w/ average inputs near steady state • Close to “right” on Baywide scale? • Offsetting errors? • High degradation/methylation rates dominate • Rapid turnover, week-month scale • Quick response of ambient MeHg? • External Loads (to water) only small/moderate effect (even @ 0.3-3x base estimate) • Water & sed linked by Kd and SSC given equilibrium/ steady state assumptions
Next Steps • Explore other parameter combos? • E.g. high meth + high sed deg look like base case, other mixes of parameters • Egregiously bad assumptions? • E.g. meth in only ½ of “well mixed” sed layer? • Equilib/SS model usable only for sensitivity test? • No benthic flux external load? • Seeking WG input • This budget (small scope, want to address major factors, not a full redesign) • Next generation model? (utility, feasibility)