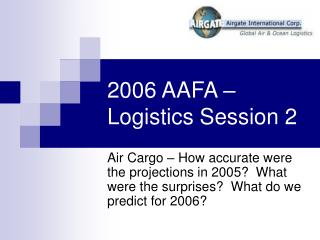
Logistics Session Part 2 - Transportation
Logistics Session Part 2 - Transportation. Henry L. (Rick) Wen Jr. VP Business Development & Public Affairs OOCL (USA) Inc. 2006 AAFA International Sourcing, Customs & Logistics Integration Conference Savannah, March 22-24, 2006. Agenda. Introduction to OOCL

Logistics Session Part 2 - Transportation
E N D
Presentation Transcript
Logistics Session Part 2 - Transportation Henry L. (Rick) Wen Jr. VP Business Development & Public Affairs OOCL (USA) Inc. 2006 AAFA International Sourcing, Customs & Logistics Integration Conference Savannah, March 22-24, 2006
Agenda • Introduction to OOCL • Record trade growth from Asia and China’s impact upon US transportation infrastructure • California Crisis-Shipping Landscape-How cross industry collaboration improved results • Affect on cost and infrastructure investment • Future outlook and trends
Introducing OOCL • Hong Kong’s largest container shipping company • Grand Alliance member • Publicly traded and privately held • 4M shipments & $4.7B in annual revenue • China expert • ISO certified and process driven • Technology Innovation – IRIS 2 & CargoSmart • Highest industry return on revenue in 2004 • Green Flag Award environmental recognition
INTRA-ASIA 33 million TEU (including Australia, Indian Subcontinent and Middle East) 12 % Growth World Container Flow 2005 TRANS-ATLANTIC 5.4 million TEU 5.3% Growth ASIA-EUROPE 12.2 million TEU 10.9% Growth TRANS-PACIFIC 18 million TEU 10.4 % Growth OTHER TRADES North-South 19.2 million TEU Intra-Regional 16.1 million TEU Source: Drewry Consultants, 2005
China’s Share of U.S. Import Volume 1995 2000 2005 Source: PIERS Trade Horizons
China’s Share of Trans-Pacific Imports 1995 2000 2005 Source: PIERS Trade Horizons
China’s apparel & footwear trend China market share China-US growth p.a. Source: US Census Bureau
Major Port Throughput Source: Drewry Shipping Consultants Ltd(figures include empties and transshipment)
Volume Growth (m Teu) Source: Ports (Dec est.)
Projected Growth (POLA/POLB) (in Million TEUs) Source: Marine Exchange of Southern California
2004 California Crisis • West Coast problem was compounded by many issues: • Trade growth and inadequate customer forecasting • Shortage of longshore labor and lower productivity of new hires • Port congestion • State and Federal regulations • Intermodal equipment (railcar, locomotive) and crew shortages • Terminal crane capacity • Rail volume capacity (ramp, on dock rail limits, trackage pinch point at Cajon Pass) • Strained truck capacity and limited trailer availability • Chassis shortage • Larger Mega Ships • Rising costs of doing business
2004 Labor Shortage No. of In-Service Cranes Source: www.pmanet.org
Shipping Landscape • New mega ships increase trade capacity • Global trade growth outpaces United States infrastructure, including port, railroad, trucking, terminal and warehouse. • Congestion & delays reduce effective vessel capacity • Panama Canal approaches 100% capacity • Supply chains become pro-longed and segmented West (intermodal) and East (all-water) • Cross-industry collaboration and synchronized activities improved shipment performance & efficiency after 2004 crisis Here’s how:
2006 Port Congestion: Beyond 2006 • US Ports Lag International Productivity: • Throughput (Teu) per gross acre: • East Coast /Gulf 4,100 • West Coast 4,600 • Major world ports 10,000 to 15,000
Port Terminal Capacity Constraint Million TEU Source: SSA
Port Terminal Capacity Constraint Source: SSA Million TEU
Cross Industry Collaboration: Ocean Carrier and Terminal Action • More labor, high capacity cranes and terminal equipment (resources) • Convert from wheeled to grounded operations: increase terminal capacity (space) • Extend Terminal’s Hours of Service “Pier-Pass” appointment system to increase capacity (time) • Implemented on July 23, 2005 • Over 30% of daily cargo moves during off-peak • 1 Million container milestone December 2005
Cross Industry Collaboration: Ocean Carrier and Terminal Action • Redeploy ships to East Coast and Pacific Northwest ports to balance port capacity: (asset utilization) • Reduce terminal free time from 5 to 4 days to accelerate goods movement (velocity) • Implement 1st receiving dates for exports to minimize terminal congestion (space) • Synchronize block stowage and promote on dock rail to improve intermodal rail performance and maximize terminal efficiency (congestion) • Develop off-dock Container Yards to relieve terminal congestion (overflow capacity)
Cargo Interest • Order earlier and prepare to hold more inventory in your pipeline • Move information up your supply chain (at origin) and available at least 24 hours prior vessel loading • Align your delivery schedules with changes in the international delivery process • Focus more on time definite vs. time to market and avoid “double dipping” • Use “cost of goods sold” profit model (20 cents a kilo vs. 6 dollars a kilo?) to build your supply chain
Value per kg of shipment Source: US Census Bureau
Increased Cost of Liner Shipping • Bunker fuel and inland fuel • Additional labor • Terminal • Extended operation hours • Wheeled to ground operation (expensive yard machinery) • Terminal appointment system • Storage charges have increased • Equipment • Trade imbalance (import: export) increases empty repositioning • Cost of equipment is up as steel costs doubled • Carriers are building larger vessels but equipment supply lags behind • Rail • Trucking
Future Outlook & Trends • Intermodal rail service improves • More “Hub and Spoke” shipments (inland distribution) • Less West Coast transloading • More East Coast distribution using trucks instead of rail • Integration of international with domestic transportation • International intermodal outpaces domestic growth • Railroads drive double stack intermodal • Smaller and more frequent shipments favor container vs. trailer • Cost and environmentally friendly for shipments >700 miles Domestic infrastructure changes to accommodate international • CPRR bans cross Canada intermodal trailers effective January 1st 2006 (others to follow) • TTX converting 48’ car wells to 40’ wells • New flatcar wells will be mostly 40’
Future Outlook and Trends • Economy of Scale & Asset Utilization • More and larger container vessels • More and larger consortia of carriers • More mergers and Acquisitions • Don’t put all your eggs in one basket • Liner shipping logistics plays a more strategic role in supply chain including domestic applications • Technology drives standardized efficiency, shipment visibility and Home Land Security applications • Moving towards a global economy