A Brief History
240 likes | 461 Vues
A Brief History. May, 2010 Ability to build disease modules at the state. 2010. May, 2006 Public Health ASP Offering Launched. December, 2006 16 th State in Production with NBS. January, 2003 NBS Launched into Production. February, 2005 NBS User Group Launched. October, 1999

A Brief History
E N D
Presentation Transcript
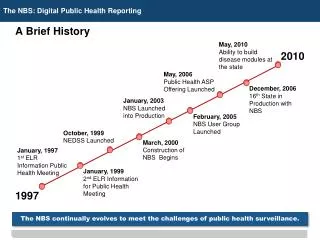
A Brief History May, 2010 Ability to build disease modules at the state 2010 May, 2006 Public Health ASP Offering Launched December, 2006 16th State in Production with NBS January, 2003 NBS Launched into Production February, 2005 NBS User Group Launched October, 1999 NEDSS Launched March, 2000 Construction of NBS Begins January, 1997 1st ELR Information Public Health Meeting January, 1999 2nd ELR Information for Public Health Meeting 1997 The NBS continually evolves to meet the challenges of public health surveillance.
Utilization in the United States NBS is implemented in 16 states and is used by over 1,000 public health practitioners
The NBS: Digital Public Health Reporting and H1N1 Flu At the Intersection of Policies, Standards and Technologies
An Agent for Change in Public Health Surveillance The NBS has facilitated the movement from paper to digital surveillance.
The NBS: Digital Public Health Reporting and H1N1 Flu Addressing Public Health Issues
The NBS: Digital Public Health Reporting and H1N1 Flu “Real World” Usage ID: Efficiency Through ELR VA: Analysis/Visualization SC: Empowering Providers AL: Bidirectional Avenues of Collaboration TX: Responding to H1N1
TX: Responding to H1N1 What We Now Know About H1N1 Source: Centers for Disease Control and Prevention
TX: Responding to H1N1 Standards Based Surveillance • Let’s Go Back to April 2009 • What will be the “source of truth” for data related to H1N1? • At what level are we going to track the disease? • What questions need to be captured? • How are we going to analyze our data? • How will we notify CDC of disease occurrence? • How can we share our work with other public health departments?
TX: Responding to H1N1 Responding to H1N1 • Identify: Early recognition that the “swine flu” emerging in Texas was actually Novel Influenza A • Collect: Immediate need was to develop a mechanism to capture data • Disseminate: Share information based on analysis of data collected using data warehouse • Adapt: Adjust surveillance based on disease trends and public health outcomes • Control: Surveillance to document the existence and potential for development of severe sequelae
ID: Efficiency Through ELR Before Electronic Laboratory Reporting • Workload: Labor intensive and prone to error • Timeliness: Reporting delays; dependency on fax, mail and phone • Accountability: “Lost in bottom of the drawer” • Completeness: Difficult to analyze the completeness of reporting
ID: Efficiency Through ELR • Electronic Laboratory Reporting to Public Health: • Salmonella is detected in a specimen submitted for a patient with symptoms of a Foodborne illness • County public health practitioner receives the electronic laboratory report and begins an investigation • State public health practitioner analyzes received ELRs NBS > Point of Care Reporting to Public Health 2 Integrated Data Repository NEDSS Base System Secure Portal 1 Laboratory 3 Public Health Data Repository Laboratory Information System Analysis
Progress with ELR ID: Efficiency Through ELR Time period 7/09 – 10/10, includes H1N1 results from Idaho Bureau of Laboratories H1N1 results 5/09 IBL 3/10 Interpath 11/08 St. Lukes 5/08 ARUP 9/07 Mayo 4/08 Quest <2007 LabCorp 2010 2008 2007 2009 Between 1/2007 and 6/2010, the number of lab reports received via ELR increased from ~22/month to ~500/month.
ID: Efficiency Through ELR Efficiency Through ELR Percentage of reportable disease lab reports received via ELR, 2007–2009* 3% ELR 97% Non- ELR 25% ELR 75% Non- ELR ~1,000 lab reports ~1,200 lab reports (20% increase) 40% ELR 60% Non- ELR *Does not include STDs Increased ELR between 2007 and 2009 led to a 40% statewide reduction in data entry time (from 195 hrs/yr to 120 hrs/yr) = more time for prevention and control activities.
ID: Efficiency Through ELR Improvements in Timelines and Completeness • Timeliness. • Since implementation of the NBS and ELR, disease reporting timeliness has increased • Example: Elapsed time between PHD receiving reports and reporting to the state has decreased from 5.0 days (95% C.I., 3.6-6.3) to 3.4 days (95% C.I., 2.7-4.8) • Completeness • Completeness varies by public health jurisdiction, but the percentage of required fields completed in the NBS in 2009 was between 88% and 100%: • 99.8% basic demographic fields (e.g., age, sex) • 98.7% onset and diagnosis date • Race and ethnicity are least likely to be complete (67%)
AL: Bidirectional Avenues of Collaboration Bidirectional Avenues of Collaboration Paper Business Process = Disconnected State Health Department • Resource intensive processing of morbidity/laboratory reports • Lost Investigations • Limited local staff development Local Health Departments • Limited feedback on investigations • Lack of analytic capabilities • Inability to monitor disease trends
AL: Bidirectional Avenues of Collaboration Bidirectional Avenues of Collaboration Digital Business Process = Connected State Health Department • Electronic receipt of laboratory and morbidity reports • Timely investigations and interventions • Real-time, electronic feedback to field staff Local Health Departments • Continual feedback on investigations • On demand analysis capabilities • Access to multi-year data sets for trend analysis
AL: Bidirectional Avenues of Collaboration Bidirectional Avenues of Collaboration
SC: Empowering Providers Paper Based Approach to Disease Reporting
SC: Empowering Providers • Provider to Public Health: • Infection Control Nurse at a hospital enters a patient’s lab report directly in the NBS to alert public health to a positive finding for Tuberculosis • Public health practitioner receives the laboratory report within their dashboard and follows up with the Infection Control Nurse for additional information • Upon investigation, CDC is electronically notified of a confirmed case of Tuberculosis NBS > Point of Care Reporting to Public Health 2 Business Process NEDSS Base System Secure Portal Provider 1 3 Public Health Data Repository National Center for Interoperability Interoperability
SC: Empowering Providers Empowering Providers Examples of Provider Based Disease Reporting NC SC GA Provider Site NBS facilitates private – public joint surveillance.
Centralized database and analytic tools enhance use of reportable disease data All health departments have a database for analysis Data is available for analysis sooner because it is in the database sooner Working from the same database results in consistent and reliable statistics Opportunity for more integrated analysis Information is used in decision making when it is readily available Once a report is developed it can be shared by all users (and across states) Users collaborate to find solutions and build skills VA: Analysis/Visualization
You mean you want to be able to use the data? Easy-to-use queries encourage non-epidemiologists to run reports Datamarts support queries and analysis by power users Disease specific datamarts provide access to all relevant fields Data from multiple ODS tables are combined, including administrative data “Flattened” data structures simplify use Data transformations simplify analysis Exportable files support analysis through other tools (Aberration detection, geospacial mapping, SAS, Logi-XML) Reports prioritize action Identify cases needing investigation when many reports are received Identify potential clusters from review of linelists Evaluation of workflow improves use of resources Analysis to evaluate data quality and completeness improve surveillance strategies support data improvement ensure appropriate interpretation Incorporation of legacy data in a datamart to support historical analysis VA: Analysis/Visualization
We collect data to guide public health action We need robust tools to analyze and visualize the data Need more access to disease-specific data Need more capacity for graphic presentation of data Need more capacity for ad-hoc analysis by users Need more ability to incorporate statistical calculations, including rates Do we build the capacity in NBS or build interfaces with other tools and applications? VA: Analysis/Visualization