Download
1 / 64
640 likes | 657 Vues
Explore the dynamics of growth, poverty, and malnutrition in India through data analysis and trends over the years. Understand the discrepancies in consumption data, falling calorie rates, rising poverty, and malnutrition issues across various states.

E N D
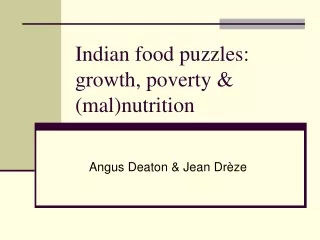
Indian food puzzles: growth, poverty & (mal)nutrition Angus Deaton & Jean Drèze
Lots of growth • Real GDP per capita growing at 3.6 percent a year since 1980 • 4.6 percent a year 00−04 • Real per capita aggregate consumption growing at 2.0 percent in the 1980s, 2.6 percent in the 1990s, and 4.7 percent 00−04 • Poverty reduction has been less than warranted by this growth rate if equally distributed • Some increase in inequality • Much more important are data inconsistencies • Coverage differences, and outright discrepancies • Survey consumption grows less rapidly than NAS consumption • Errors on both sides • Inconsistent survey instruments from year to year
Growth across the distribution • NSS growth may be too low • Generally some growth at all fractiles
Table 1: Growth by percentiles NSS data
Is this really correct? Data from National Nutritional Monitoring Bureau Note: Andhra Pradesh, Gujarat, Karnataka, Kerala, Madhya Pradesh, Maharashtra, Orissa, Tamil Nadu, and West Bengal. 1988-90 and 1996-97 estimates exclude Madhya Pradesh and West Bengal. The 2004-05 figures exclude Gujarat..
Cereal + pulses availability 500 400 Cereal availability 300 gms per capita per day 200 100 Changes in government stocks of cereal 0 1950 1960 1970 1980 1990 2000 From Economic Survey of India
Cereal + pulses availability 500 400 Cereal availability 300 NSS consumption gms per capita per day 200 100 Changes in government stocks of cereal 0 1950 1960 1970 1980 1990 2000 year From Economic Survey of India
AVAILABILITY OF CEREALS, GM PER PERSON PER DAY 250 RICE 200 150 OTHER CEREALS WHEAT 100 50 1950 1960 1970 1980 1990 2000 year Ministry of Agriculture
What about Engel? • Engel’s law says that the share of food in the budget falls as incomes rise • Says nothing about levels of food consumption • Calorie Engel curves show calories (including cereal calories) rising with income (or at least pce) over a range • So we would expect calorie consumption to rise as living standards improve • India is growing rapidly, but remains poor • Average per capita calorie consumption in the bottom decile of pce in 1983 was less than 1,400 calories, and has been around 1,500 calories for last 20 years
Why are calories falling? • One interpretation is that poverty and hunger are increasing, especially among rural households • “Republic of hunger” • If poor people were getting better-off, they would consume more calories, especially more cereals • So some combination of falling incomes, rising prices, and unemployment must be impoverishing them • Engel curves are correct, calorie data are correct, and NSS is overstating consumption levels
Rising poverty • A weaker argument is based on calorie adequacy • India’s poverty lines were originally set so that at the PL, households on average obtained 2,400 calories (rural) and 2,100 calories (urban) • So we can calculate how many people are meeting these standards over time
Calorie poverty rates Percentages of persons below recommended daily calorie allowances Calculations from NSS data
But, but . . . . • The purchasing power of the original poverty lines has not changed (up to possible errors in price indexes) • Pronab Sen (EPW) has shown that, if people around the poverty line were to pay the average price per calorie paid by people below the poverty line, they would meet the calorie norms • So they must be reducing calories because they want to, not because they have to. • Reports of numbers of people not getting “two square meals a day” have fallen dramatically over the last 20 years
What about malnutrition • NFHS 3 from 2005−06 • NFHS 1 (92−93) and NFHS 2 (98−99) are available but did not consistently measure all children across India • In the 90s, children who were underweight (z-score less than −2 for weight for age) fell from 52 to 47 percent • Latest results for most states show little improvement overall • In the 90s, stunting improved in some states, worsened in others • Latest results show improvements in most states (18 out of 21: worse in Arunachal Pradesh and Karnataka) • Wasting has got worse (all but 4 out of 21 states) • Much worse than might have been expected given growth and poverty estimates • Better than expected if there is widespread and increasing hunger
Andhra Pradesh Arunachal Pradesh Assam Chhattisgarh Delhi 60 40 20 0 Gujarat Haryana Himachal Pradesh Jammu & Kashmir Karnataka 60 40 20 0 Kerala Madhya Pradesh Maharashtra Manipur Meghalaya 60 40 20 0 Orissa Punjab Rajasthan Uttar Pradesh Uttaranchal 60 40 20 0 West Bengal PREVALENCE OF STUNTING Ages 0-3 60 40 20 0 1992-93 1998-99 2005-06 Graphs by State
Andhra Pradesh Arunachal Pradesh Assam Chhattisgarh Delhi 40 30 20 10 0 Gujarat Haryana Himachal Pradesh Jammu & Kashmir Karnataka 40 30 20 10 0 Kerala Madhya Pradesh Maharashtra Manipur Meghalaya 40 30 20 10 0 Orissa Punjab Rajasthan Uttar Pradesh Uttaranchal 40 30 20 10 0 West Bengal PREVALENCE OF WASTING Ages 0-3 40 30 20 10 0 mean of r1 mean of r2 mean of r3 Graphs by State
Andhra Pradesh Arunachal Pradesh Assam Chhattisgarh Delhi 60 40 20 0 Gujarat Haryana Himachal Pradesh Jammu & Kashmir Karnataka 60 40 20 0 Kerala Madhya Pradesh Maharashtra Manipur Meghalaya 60 40 20 0 Orissa Punjab Rajasthan Uttar Pradesh Uttaranchal 60 40 20 0 West Bengal PREVALENCE OF UNDERWEIGHT Ages 0-3 60 40 20 0 1992-93 1998-99 2005-06 Graphs by State
Indian women 151.5 151 mean height 150.5 are growing taller, though little progress for those born between 1965 and 1975 150 149.5 10 20 30 40 50 Age
152 India 151 150 Bangladesh mean height Nepal 149 and not as rapidly as women in Nepal and Bangladesh, though they are taller to start with 148 10 20 30 40 50 Age
160 155 150 145 And they remain among the smallest women in the world 170 Europe Central Asia 165 Africa US Average height China Latin America & Caribbean South Asia 6 7 8 9 10 Log of real GDP per head in year of birth
INDIAN NSS REGIONS 156 154 152 mean women’s height in 1989/99 150 black is urban blue is rural 148 1500 2000 2500 3000 mean per capita calories in region in 1983
Fats and calories • Much has been made of “nutritional transition” in countries like India • Replacement of cereals by fats (milk, edible oil, chicken) and “animal source” foods, as well as sugar • Concerns about consequences for health, especially diabetes and CVD • But Indian rural poor are desperately short of fat, and for them, the nutritional transition is a good thing.