Irish Population 2002
300 likes | 326 Vues
Explore detailed data on demographics, housing, education, and employment in Ireland from 2002. Discover changes in population size, age groups, household compositions, employment rates, and more. This presentation provides a comprehensive overview for geography teachers.

Irish Population 2002
E N D
Presentation Transcript
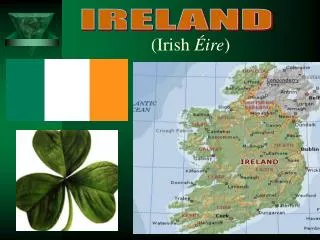
Irish Population 2002 Presentation to Geography Teachers Rathmines, 2nd October 2004 Gerry O’Hanlon,
Layout of presentation • Population size and change • Population by age group • Household composition • Employment and education • Usual Residents and Nationality • Travel patterns • Housing characteristics
Total population 3,917,203 • 1996/2002 increase • 291,116 • 8 per cent • Highest population since 1871 • annual change % • 1996/2002 1.3 • 1991/1996 0.6
Highlights 1996/2002 • Dublin +6.1% - less than State (+8%) • Meath (+22%) and Kildare (+21%) main growth areas • Also strong growth in other Leinster counties • Urban +10.7%; rural +4.3%
Geographic distribution • Leinster +9.4% • Munster +6.5% • Connacht +7.2% • Ulster (part of) +5.3% • Leinster’s population over 2 million
Urban/Rural population 2002: Urban 2.3million (60%), Rural 1.6 million (40%)
Labour force participation rates, 1926-2002 • Male rates historically higher • Max difference 56% in 1946 • Increase in female rate since 1981 • Female home duties: • 62% in 1971 • 27% in 2002 Female labour force participation rate 2002 EU-15: 47.6%, Ireland: 48.8%
Sectoral employment shares, 1926-2002 • Agriculture • 50% in 1926 • 6% in 2002 • Industry • 13% in 1926 • 32% in 1981 • 25% in 2002 • Services • 34% in 1926 • 69% in 2002
Irish & Non-Irish nationals by age, 2002 Irish 3.6m Other EU 133,000 Rest of Europe 23,000 Africa 21,000 Asia 22,000 Other Stated 25,000
Labour force participation & unemployment (PES), 2002 Persons aged 15-64 years
Educational attainment - Irish and non-Irish nationals, 2002 Persons aged 20-44
Percentage of workers travelling 20+ miles to work, 2002 12% of workers travelled 20 miles and over to work each day
House type by period built 53 per cent of housing stock built since 1971 23 per cent built since 1991 77 per cent of housing stock owner occupied One in five private rented dwellings built since 1996
Housing characteristics, 2002 • Persons per room • 1.2 in 1926; 0.5 in 2002 • 408,000 (32%) housing units with septic tank in 2002; 345,000 (34%) in 1991 • One in four housing units built since 1991 were one-off houses in rural areas • Galway 63%, Monaghan 54%, Roscommon 53%, Cavan 52%, Leitrim 53%
Vacant Dwellings • Habitable dwellings Total % • All habitable dwellings 1,458,112 100.0 • Occupied 1,287,958 88.3 • Vacant Holiday Homes 39,383 2.7 • Other Vacant dwellings (approx) 80,000 5.5 • Other (absent etc.) 50,771 3.3 • Holiday homes highest (%) in Donegal, Cork, Kerry, and Wexford • Reasons for other vacant dwellings are ‘new’ dwellings, for sale, owner deceased or in hospital, second dwelling not identified as holiday home • Other vacant dwellings highest % in Leitrim, Donegal, Cork, Kerry, Mayo, Galway