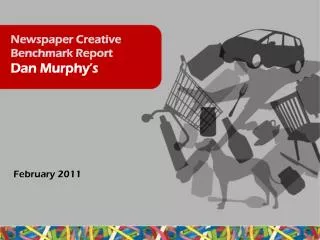
Newspaper Creative Benchmark Report Dan Murphy’s
280 likes | 465 Vues
Newspaper Creative Benchmark Report Dan Murphy’s. February 2011. It’s a component of the Newspaper Effectiveness Metric which is run by the newspaper industry marketing body, The Newspaper Works. A monthly study designed; To measure and identify the effectiveness of newspaper creative

Newspaper Creative Benchmark Report Dan Murphy’s
E N D
Presentation Transcript
Newspaper Creative Benchmark Report Dan Murphy’s February 2011
It’s a component of the Newspaper Effectiveness Metric which is run by the newspaper industry marketing body, The Newspaper Works. A monthly study designed; • To measure and identify the effectiveness of newspaper creative • To help improve understanding of how to use newspapers effectively • To improve the understanding of the roles newspaper advertising can play • To improve the standard of newspaper creative • To provide a consistent metric that is accepted as the industry standard Dan Murphy’s was included in the February 2011 study
Pre/post effectiveness studies, measuring in-market effects and how newspaper work with Television Comprehensive analysis of how newspapers can best be used to influence purchase behaviour Comparison of creative against category averages The Newspaper Works’ effectiveness partner:
Recognised industry measures + Newspaper measures Proprietary newspaper measures The Newspaper Works’ effectiveness partner:
We’ve seen Dan Murphy’s evolve their Retail ads over time
We tested the change in creative in 2009The latest creative reflects an evolution of those changes February 2011 May 2009 August 2008 Market: Sydney Size: DPS Position: EGN Market: Sydney Size: DPS Position: EGN Market: Brisbane Size: DPS Position: EGN
Dan Murphys was one of 9 ads tested in Sydney • Sample: Australians 16+ • Sample size: n=110 • Fieldwork: 15–21 February 2011 • Conducted online by Ipsos MediaCT • Benchmarks used: Retail Average (see appendix for details)
There is an increased perception of clutter and ‘too much information’ found in testing of the current ad. However, this has not damaged the ad’s overall effectiveness.
+13 +14 +16 * * Caution – small sample sizes. Nobody Beats n=42 , Price, Range Trust n=27, Australia Day n=38 Dan Murphy’s continues to do well in driving Ad Recognition and Interest, achieving measures well above category norms. The current ad tested reflects a similar performance to ‘Nobody Beats ‘08’, indicating the template introduced in ‘09 is well established. Significantly different to Retail Average at 90% c.l. Note: Ad Recognition and Brand Linkage can be affected by weight of campaign and timing of research
+23 +18 +12 All three ads are positive contributors to brand equity measures with the current ad doing very well to aid relevance, scoring well above category norms Significantly different to Retail Average at 90% c.l.
**New measure introduced in March 2010, norms are not available
The message takeout generated by the ad was right on target with ‘Sale on alcohol’coming through very strongly **New measure introduced in March 2010, norms are not available
All three tested ads share a similar footprint, and outperform Retail Averages in providing Information and delivering a Call to Action Retail Average
% scores The current ad inspires strong levels of store visitation and product purchase. **New measure introduced in March 2010, norms are not yet available
: Visit Store % : Try/Buy % While we are yet to develop norms for ActionMap metrics, Dan Murphy’s compares highly favourably for this measure versus other retailers we’ve tested. The Coles ‘1/2 price’ ad (Feb ‘11) has achieved the highest measurement we’ve seen to date for stimulating intention to purchase and store visitation. **New measure introduced in March 2010, norms are not yet available
The Call to Action comparison +2.2x higher than All Newspaper norm +1.95x higher than All Newspaper norm +2.0x higher than All Newspaper norm +2.0x higher than All Newspaper norm +1.9x higher than All Newspaper norm Dan Murphy’s is performing well above the Retail Category average for generating Call to Action. Factors such as the strength of an offer, and pricing, can impact on an ad’s performance with this measure. The Coles ‘Feed Your Family’ ad has held the #1 position for results in this area (of ads tested) since May 2009
Retail Average The First Choice ad from November ‘09 delivers to a very similar Rolemap but there is no clear evidence as to why it pulls out a little more strongly against Call to Action. The offer itself, and prices, can contribute to this measure.
The Australia Day ad performed above the Retail category average in nearly all measures but especially as regards call to action, and brand relevance • The ad performs very closely to previous Dan Murphy’s ads and while the perception of the ad being cluttered has risen somewhat, this is not negatively impacting on the ad’s overall effectiveness • It may constitute a watchout, in terms of continuing to present the information in an easily digestible format • All in all, a very effective ad to generate Retail results.
3.1x Higher than retail average 5.7x Higher than retail average 1.7x Higher than retail average 2.2x Higher than retail average 4.4x Higher than retail average 3.8x Higher than retail average All newspaper norm. December 2010 (Updated monthly)
Established in 2006 by the major Australian newspaper publishers: • News Limited • Fairfax Media (including Rural Press) • APN News and Media • West Australian Newspapers • Represents paid national, metropolitan, regional and community titles. • Primary aims: • To promote newspapers as a powerful medium for advertisers • To ensure that newspapers are perceived as being contemporary and relevant in a transforming media landscape
Testing of randomly selected and hand picked newspaper display ads • Over 7,000 ad observations in total • 36 test ads (27 randomly selected, 9 hand picked) • 100+ observations per ad • Population representative sample of the five mainland state capitals • Conducted online by Ipsos Media CT, July-August and October – November 2008 • Sample size 2,475
Newspapers are a powerful medium to utilise across a broad range of strategic roles. Six strategic advertising roles have been validated both qualitatively and quantitatively, resulting in the creation of Role Map, one of two proprietary newspaper metrics. Role Map demonstrates how consumers connect with newspaper advertising across the six roles, comparing the performance of creative against a footprint of all ads tested. Retail average Statements are tailored to be appropriate to the advertising category.
Newspapers are recognised as an effective medium for delivering a Call to Action. Action Map, the third proprietary newspaper metric, expands on this strategic role to provide an understanding of the types of action a newspaper ad inspires. Measured via forced exposure, people are asked about the actions they would consider taking (or have taken) as a result of seeing the ad. New measure introduced in March 2010, norm not yet available.
Another proprietary newspaper metric provides a set of creative diagnostics unique to the attributes of newspaper advertising. They’ve been developed to help identify areas for improvement where results across other brand and advertising measures may require further analysis and interrogation. Statements are tailored to be appropriate to the advertising category. Retail average