Download

1 / 37
410 likes | 649 Vues
Laboratory in Oceanography: Data and Methods. Gridding and Interpolation Methods. MAR599, Spring 2009 Anne-Marie E.G. Brunner-Suzuki. The problem – math vs. reality. Most analysis are designed for long and densely sampled series with equally space measurements in time or space. .

E N D
Laboratory in Oceanography: Data and Methods Gridding and Interpolation Methods MAR599, Spring 2009 Anne-Marie E.G. Brunner-Suzuki
The problem – math vs. reality Most analysis are designed for long and densely sampled series with equally space measurements in time or space.
Data gaps • Equipment failure • Ship time is expensive • Weather conditions (ship, satellite) • Editing out errors • Use of historical data, which often had different goals (analysing the mean state of the ocean) • Geographic distribution (moorings, buoys, ships) of monitoring stations is usually not uniformely spaced • Resolving smaller subject dynamics
Interpolation (Theory) • Linear Interpolation • Fit a straight line between two data points choosing interpolated values at the appropriate positions along that line.
Interpolation (Theory) Linear Interpolation = straight line = first-order polynomial
Polynomial Interpolation • To interpolate between more than two points simultaneously. • Through three points we can find a unique polynomial of order ? Through four points of order ? • Methods to look for are Vandermonde, Lagrange and Newton. • f(x) =a0 + a1x^1 + a2x^2 + … + amx^m • All coefficients a influence all of x. m needs to be determined by trial and error. Check by comparing the residuals. • It oscillates between the data.
Vandermonde Matrix • p(x) = 3.2 x7 - 4.1 x4 + 9.2 x2 + 1.2 is of order 7. • Suppose we have 3 points (2, 5), (3, 6), (7, 4) and we want to fit a quadratic polynomial through these points. The general form is p(x) = c1x2 + c2x + c3. Thus, if we were to simply evaluate p(x) at these three points, we get three equations: • p(2) = c1 4 + c2 2 + c3 = 5p(3) = c1 9 + c2 3 + c3 = 6p(7) = c1 49 + c2 7 + c3 = 4
This, however, is a system of equations. • To solve: Writing down the general polynomial of degree n - 1, • Evaluating the polynomial at the points x1, ..., xn, and • Solving the resulting system of linear equations. • Rather than performing all of these operations, simply write down the problem in the form Vc = y where y is the vector of y values, c is the vector of coefficients (‘x’), and V is the Vandermonde matrix. See matlab example.
(cubic) Spline Interpolation • Piecewise polynomial, avoids the Runge phenomenon. • Is applied to a series of segments of the data record rather the entire series • Spline functions can overcome some discontinuities or sharp corners, where the segments join. • Good for fitting non-analytical distributions • No advantage to polynomial interpolation when applied to either well-behaved functions or dense data
(cubic) Spline Interpolation • Approximate the interpolation function y(x) over the interval [a,b] by deviding [a,b] into subregions with continuity at the joints: • a = u0 < u1 < u2 … < uN = b • For each subinterval y(x) is a polynomial of order N or smaller. • At each joint y(x) and it's N-1 derivatives are continuous. • N=3: cubic spline, most common.
(cubic) Spline Interpolation • Consider data (xi,yi) i=1...N, y'(x), y''(x) exist for all x and y'''(x) is constant for all x. • At all joints: • the spline function fi(xi) is continuous • It's slope y’(x) is continuous • It's curvature y’’(x) is continuous • Because y'''(x)= const => y''(x) is also linear.
(cubic) Spline Interpolation As a note: It can be useful to transform the data before a spline fit, taking the log of it. Perform the interpolation, and then convert back by exponentiation to the original space. This can ensure positivity.
FFT Interpolation • “The original vector x is transformed to the Fourier domain using fft and then transformed back with more points.” • Matlab transforms to the Fourier domain, there matlab pads the spectrum with zeros, and then transforms the function back with more points.
More Matlab functions Interp2: 2D interpolation Interp3: 3D interpolation Spline toolbox: (not always available) for other splines but cubic. Delauny: triangulation by finding the natural neighbors. Voronoi: polygon Trimesh: mesh with triangles Dsearch Tsearch
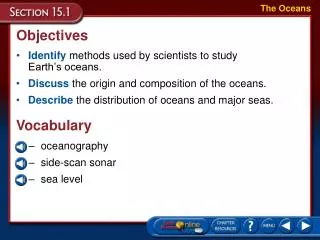
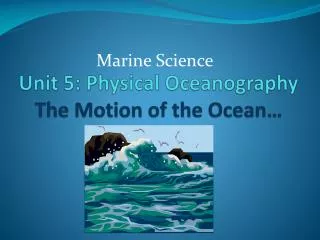
Gridding • In many cases in oceanography, we do not have evenly spaced observations. We need to grid our unevenly spaced data by determining some set of evenly spaced estimates that approximate the observations. • Imagesc, pcolor, surf all need equally spaced data.
Gridding – oceanographic problems • By plotting 5deg squares spatial coverage increases towards lower latitudes • A mix of historical data and different instruments (XBT vs MBT) • Seasonality in data coverage (winter vs. summer) • Historical Observations are often along meridians or parallel to longitudes • The main goal was to find the “mean state of the ocean” • Changes in instrument calibration • friday: objective analysis
References • Data Analysis Methods in Physical Oceanography by W.J. Emery and R.E. Thomson, 1993.
Laboratory in Oceanography: Data and Methods Optimal Interpolation MAR599, Spring 2009 Anne-Marie E.G. Brunner-Suzuki
Optimal Interpolation • Terminology: Optimal Interpolation, Objective mapping, Objective analysis, BLUE (Best Linear Unbiased Estimator) or Gauss-Markov smoothing.
Optimal Interpolation • Models (approximate dynamics) are imperfect. They are approximations to the truth. Possible errors are: initial conditions, imperfect parameterization, inaccurate forcing. • Observations (state variables) are imperfect as well. Errors from instruments, statistical errors, measurement errors.
One step back – direct insertion • Model predictions are replaced with observations available. • Assumption: Perfect observations, imperfect model. • Model dynamics spread information to nearby gridpoints. • Blending uses a weighted average
“Nudging” or Newtonian Damping • The model is forced over several time steps towards the observation: Equ. of Motion(Xmodel)=- (Xmodel-Xobs)/Tdamp
Next step: OI • Before: model adjustment only at grid point of observation • Now: all points within the de-correlation distance of the observation. • OI estimates the fields at an arbitrary location through a linear combination of the available data. • Weights are chosen, so that the expected error of the estimate in at a minimum and the estimate itself is unbiased • The natural covariance length and time scales of the data and true field enter into the computation of the linear weights.
Optimal Interpolation • Assumptions: • statistics are stationary, homogenous and isotropic • For each model variable, only a few observations are important • The error covariance is empirically derived and held constant over time
Let’s go through the math • r,s: where the observations are made • x: where to interpolate to • ξ: is the distance from x. • Θ: is the true value, or target value • covariance: is represented by a function F(ξ)
The observations are: • The measurement error and the observed value is not correlated: • Errors at two points are not correlated • E is the variance.
How to estimate the true value: • From the previous slide:
Ars and Cxr are constant for given observation points! • The error in the estimation is: it can be used to construct probable error maps in the estimation (derivation follows) • Cxx is the natural variation without data present • The second term shows data influence
How did we derive this? • α are some weights still to be determined:
The error variance of the estimation: • If we minimize this error variance we get the previous equation: > or = to 0
Once we know Ars and Cxr • We can determine the estimate of the true value: • Let’s assume there are M grid locations x and N data locations r:
References: • Bretherton, 1976: A technique for objective analysis and design of oceanographic experiments applied to MODE-73* • Data analysis in physical Oceanography by Emery and Thompson, 2nd edition (watch our for errors in their derivation!)