Download
1 / 54
540 likes | 746 Vues
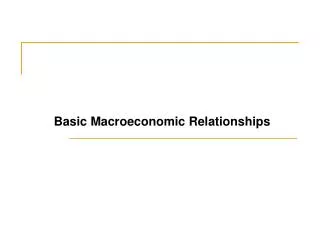
An Introduction to Basic Macroeconomic Markets. Understanding Macroeconomics : Our Game Plan. Understanding Macroeconomics -- Our Game Plan. A model is like a road map. It illustrates inter-relationships .

E N D
Understanding Macroeconomics-- Our Game Plan • A model is like a road map. It illustrates inter-relationships. • We will use the circular flow of output and income between the business and household sectors to illustrate macro-economic inter-relationships. • As our macroeconomic model is developed, initially, we will assume that monetary policy (the money supply) and fiscal policy (taxes and government expenditures) are constant.
Four Key Markets Coordinatethe Circular Flow of Income • Goods and Services market • Resource market • Loanable Funds market • Foreign Exchange market
Four Key Markets • Goods and Services Market: • Businesses supply goods & services in exchange for sales revenue. • Households, investors, governments, and foreigners (net exports) demand goods. • Resource Market:Highly aggregated market where … • business firms demand resources, and, • households supply labor and other resources in exchange for income.
Four Key Markets • Loanable Funds Market:Coordinates actions of borrowers and lenders. • Foreign Exchange Market:Coordinates the actions of Americans who … • demand foreign currency (in order to buy things abroad), and, • foreigners that supply foreign currencies in exchange for dollars (so they can buy things from Americans).
The Circular Flow Diagram • Four key markets coordinate the circular flow of income. • Resource market: coordinates actions of businesses demanding resources and households supplying them in exchange for income. • Goods & services market: coordinates the demand for and supply of domestic production (GDP). • Foreign exchange market brings the purchases (imports) from foreigners into balance with the sales (exports plus net inflow of capital) to them. • Loanable funds market brings net household saving & net inflow of foreign capital into balance with borrowing of businesses and governments.
Aggregate Demand for Goods & Services • Aggregate demand (AD) curve: indicates the various quantities of domestically produced goods & services purchasers are willing to buy at different price levels. • The AD curve slopes downward to the right, indicating an inverse relationship between the amount of goods and services demanded and the price level.
A reduction in the price level will increase the quantity of goods & services demanded. AD Aggregate Demand Curve PriceLevel • As illustrated here, when the general price level in the economy declines from P1 to P2, the quantity of goods and services purchased will increase from Y1 to Y2. P1 P2 Goods & Services(real GDP) Y1 Y2
A reduction in the price level will increase the quantity of goods & services demanded. AD Aggregate Demand Curve • Other things constant, a lower price level will increase the wealth of people holding the fixed quantity of money, lead to lower interest rates, and make domestically produced goods cheaper relative to foreign goods. • Each of these factors tends to increase the quantity of goods and services purchased at the lower price level. PriceLevel P1 P2 Goods & Services(real GDP) Y1 Y2
Why Does the AggregateDemand Curve Slope Downward? • A lower price level increases the purchasing power of the fixed quantity of money. • A lower price level will reduce the demand for money and lower the real interest rate, which then stimulates additional purchases during the current period. • Other things constant, a lower price level will make domestically produced goods less expensive relative to foreign goods.
Aggregate Supplyof Goods & Services • When considering the Aggregate Supply curve, it is important to distinguish between the short-run and the long-run. • Short-run: • A period of time during which some prices, particularly those in resource markets, are set by prior contracts and agreements. • Therefore, in the short-run, households and businesses are unable to adjust these prices when unexpected changes occur, including unexpected changes in the price level. • Long-run: • A period of sufficient time, that people have the opportunity to modify their behavior in response to price changes.
Short-Run Aggregate Supply (SRAS) • The Short-run Aggregate Supply Curve (SRAS)indicates the various quantities of goods and services that domestic firms will supply in response to changing demand conditions that alter the level of prices in the goods and services market. • The SRAS curve slopes upward to the right. • The upward slope reflects the fact that in the short run an unanticipated increase in the price level will improve the profitability of firms. • Firms respond to this increase in the price level with an expansion in output.
SRAS (P100) An increase in theprice level will increase the quantity supplied in the short run. Short-Run Aggregate Supply Curve PriceLevel • The SRAS shows the relationship between the price level and the quantity supplied of goods & services by producers. • In the short-run, firms will expand output as the price level increases because higher prices improve profit margins since many components of costs will be temporarily fixed as the result of prior long-term commitments. P105 P100 P95 Goods & Services(real GDP) Y1 Y2 Y3
Long-Run Aggregate Supply (LRAS) • LRAS indicates the relationship between the price level and quantity of output after decision makers have had sufficient time to adjust their prior commitments where possible. • LRAS is related to the economy's production possibilities constraint. • A higher price level does not loosen the constraints imposed by the economy's resource base, level of technology, and the efficiency of its institutional arrangements. • Therefore, an increase in the price level will not lead to a sustainable expansion in output. • Thus, the LRAS curve is vertical.
LRAS Change in price level does not affect quantity supplied in the longrun. Potential GDP YF (full employment rate of output) Long-Run Aggregate Supply Curve PriceLevel • In the long-run, a higher price level will not expand an economy’s rate of output. • Once people have time to adjust their long-term commitments, resource markets (and costs) will adjust to the higher levels of prices and thereby remove the incentive of firms to continue to supply a larger output. Goods & Services(real GDP)
LRAS Change in price level does not affect quantity supplied in the longrun. Potential GDP YF (full employment rate of output) Long-Run Aggregate Supply Curve PriceLevel • An economy’s full employment rate of output (YF), the largest output rate that is sustainable, is determined by the supply of resources, level of technology, and the structure of the institutions. These factors that are insensitive to changes in the price level. • Hence the vertical LRAS curve. Goods & Services(real GDP)
Questions for Thought: 1. What is the circular flow of income? What are the four key markets of the circular flow model? 2. Why is the aggregate demand curve for goods & services inversely related to the price level? What does this inverse relationship indicate? 3. What are the major factors that influence the quantity of goods & services a group of people can produce in the long run? Why is the long run aggregate supply curve (LRAS) vertical? What does the vertical nature of the curve indicate?
Questions for Thought: 4. Why does the short run aggregate supply (SRAS) curve slope upward to the right? What does the upward slope indicate? 5. If the prices of both (a) resources and (b) goods and services increase proportionally will business firms have a greater incentive to expand output? Why or why not?
Short-run Equilibrium in the Goods & Services Market • Short-run Equilibrium: • Short-run equilibrium is present in the goods & services market at the price level Pwhere the aggregate quantity demandedis equal to the aggregate quantity supplied. • This occurs (graphically) at the output rate where the AD and SRAS curves intersect. • At this market clearing price P, the amount that buyers want to purchase is just equal to the quantity that sellers are willing to supply during the current period.
SRAS (P100) Intersection of AD and SRAS determines output. AD Short-run Equilibrium in the Goods & Services Market • Short-run equilibrium in the goods and services market occurs at the price level P where AD& SRAS intersect. • If the price were lower than P, general excess demand in the goods and services market would push prices upward. • Conversely, if the price level were higher than P, excess supply would result in falling prices. PriceLevel P Goods & Services(real GDP) Y
Long-run Equilibrium in the Goods & Services Market • Long-run Equilibrium: • Long-run equilibrium requires that decision makers, who agreed to long-term contracts influencing current prices and costs, correctly anticipated the current price level at the time they arrived at the agreements. • If this is not the case, buyers and sellers will want to modify the agreements when the long-term contracts expire.
Long-run Equilibrium in the Goods & Services Market • When long-run equilibrium is present: • Potential GDP is equal to the economy’s maximum sustainable output consistent with its resource base, current technology, and institutional structure. • The Economy is operating at full employment. • Actual rate of unemployment equals the natural rate of unemployment. • Occurs (graphically) at the output rate where the AD, SRAS, & LRAS curves intersect.
LRAS SRAS (P100) Note, at this point, the quantity demanded justequals quantity supplied. AD YF (full employment rate of output) Long-run Equilibrium in the Goods & Services Market PriceLevel • The subscripts on SRAS and AD indicate that buyers and sellers alike anticipated the price level P100 (where 100 represents an index of prices during an earlier base year). • When the anticipated price level is attained, output YF will be equal to potential GDP and full employment will be present. P100 Goods & Services(real GDP) Y
Disequilibrium in the Goods and Services Market • Disequilibrium:Adjustments that occur when output differs from long-run potential. • An unexpected change in the price level (rate of inflation) will alter the rate of output in the short-run. • An unexpected increase in the price level will improve the profit margins of firms and thereby induce them to expand output and employment in the short-run. • An unexpected decline in the price level will reduce profitability, which will cause firms to cut back on output and employment.
Questions for Thought: • If the price level in the current period is higher than what buyers and sellers anticipated, what will tend to happen to real wages and the level of employment? How will the profit margins of business firms be affected? How will the actual rate of unemployment compare with the natural rate of unemployment? Will the current rate of output be sustainable in the future? • Why is an unanticipated increase in the price level likely to expand output in the short run, but not in the long run?
Resource Market • Demand for Resources:Business firms demand resources because they contribute to the production of goods the firm expects to sell at a profit. • The demand curve for resources slopes down and to the right. • Supply of Resources:Households supply resources in exchange for income. • Higher prices increase the incentive to supply resources; thus, the supply curve slopes up and to the right. • Equilibrium price:Known as the market clearing price, equilibrium price brings the resources demanded by firms into balance with those supplied by resource owners.
S Households supplyresources in exchange for income Businesses demandresources to produce goods & services D Equilibrium in the Resource Market Real resource price (wage) Resource market • As resource prices increase, the amount demanded by producers declines and the amount supplied by resource owners expands. • In equilibrium, the resource price brings quantity demanded into equality with the quantity supplied. • The labor market is a large part of the resource market. PR Quantity Employment Q
Loanable Funds Market • The interest rate coordinates the actions of borrowers and lenders. • From the borrower's viewpoint, interest is the cost paid for earlier availability. • From the lender’s viewpoint, interest is a premium received for waiting, for delaying possible current expenditures into the future.
The Money and Real Interest Rates • The money interest rate is the nominal price of loanable funds. • When inflation is anticipated, lenders will demand (and borrowers will pay) a higher money interest rate to compensate for the expected decline in the purchasing power of the dollar. • The real interest rate is the real price of loanable funds. • The difference between the money rate and real interest rate is the inflationary premium. • This premium reflects the expected decline in the purchasing power of the dollar during the period the loan is outstanding. = Realinterest rate Moneyinterest rate Inflationarypremium –
Here, the moneyand real interestrates are equal i = r = Inflation and Interest Rates Loanable Fundsmarket InterestRate • Suppose that when people expect the general level of prices to remain stable (zero inflation), a 6% interest rate brings equilibrium in the loanable funds market. • Under these conditions, the money and real interest rates will be equal (here 6%). S (stable prices expected) i = .06 D (stable prices expected) Quantity of funds Q
S (5% inflation expected) i = .11 D (5% inflation expected) Inflationary premiumequals expectedrate of inflation Inflation and Interest Rates Loanable Fundsmarket InterestRate • When people expect prices to rise at a 5% rate, the money interest rate (i) will rise to 11% even though the real interest rate (r) remains constant at 6%. S (stable prices expected) i = .06 D (stable prices expected) Quantity of funds Q
Does Inflation Help Borrowers? • When inflation occurs, borrowers will be able to repay their loans with dollars that have less purchasing power. • If the actual rate of inflation is greater than the expected, borrowers will gain at the expense of lenders. • If the actual rate of inflation is less than the expected, lenders will gain at the expense of borrowers. • When the rate of inflation is accurately anticipated, the inflationary premium built into the nominal interest rate will fully compensate lenders for the reduction in the purchasing power of the dollar as the loan is repaid.
Capitalinflow D2 Capitaloutflow D1 Interest Rates and the Inflow / Outflow of Capital Loanable Fundsmarket • The demandand supply in the loanable funds market will determine the interest rate. • When demand for loanable funds is strong (D2), real interest rates will be high (r2) and there will be a inflow of capital. • In contrast, weak demand(D1) and low interest rates (r1) will lead to capital outflow. InterestRate Supply ofloanablefunds Domesticsaving r2 r0 r1 D0 Quantity of funds Q0 Q2 Q1
Foreign Exchange Market • When Americans buy from foreigners and make investments abroad (outflow of capital), their actions generate a demand for foreign currency in the foreign exchange market. • On the other hand, when Americans sell products and assets (including bonds) to foreigners, their transactions will generate a supply of foreign currency (in exchange for dollars) in the foreign exchange market. • The exchange rate will bring the quantity of foreign exchange demanded into equality with the quantity supplied.
S (exports + capital inflow) [Sales to Foreigners] Depreciationof dollar D (imports + capital outflow) [Purchases from Foreigners] Appreciationof dollar Foreign Exchange Market • Americans demand foreign currencies to import goods and services and make investments abroad. • Foreigners supply their currency in exchange for dollars to purchase American exports and undertake investments in the United States. • The exchange rate brings quantity demanded into balance with the quantity supplied and will bring (imports + capital outflow) into equality with (exports + capital inflow). Foreign Exchangemarket Dollar price(of foreign currency) P1 Quantityof currency Q
Capital Flows and Trade Flows • When equilibrium is present in the foreign exchange market, the following relation exists: • This relation can be re-written as: • The right side of this equation (capital inflow - capital outflow) is called net capital inflow. • Net capital inflow may be: • positive, reflecting a net inflow of capital, or, • negative, reflecting a net outflow of capital. CapitalOutflow CapitalInflow CapitalInflow CapitalOutflow = = Imports Exports Imports Exports + - + –
Capital Flows and Trade Flows • The left side of the equation above is called the trade balance. • When imports exceed exports, a trade deficit occurs. • If, instead, exports exceed imports, a trade surplus is present. • When the exchange rate is determined by market forces, trade deficits will be closely linked with a net inflow of capital. • (See the following exhibit for evidence on this point.) • Conversely, trade surpluses will be closely linked with a net outflow of capital. CapitalOutflow CapitalInflow = Imports Exports + –
Net Capital Inflow as a share of GDP 6% U.S. Capital Flows and Trade Flows: 1978-2012 5% 4% • When a country’s exchange rate is determined by market forces, the size of the net inflow of capital and trade deficit will be closely linked. • Notice (to the right) that when the United States has experienced an increase in net capital inflow, its trade deficit has increased by a similar magnitude. 3% 2% 1% 0% 2012 2008 1998 2003 1993 1983 1988 1978 Exports – Imports as a share of GDP 2008 1998 2003 1993 1983 1988 1978 0% 2012 -1% -2% -3% -4% -5% -6% 15th edition Gwartney-Stroup Sobel-Macpherson
Are Trade Deficits Bad? • A trade deficit reflects an inflow of capital (borrowing financial capital from foreigners). • Are trade deficits bad? • This depends on how the funds are used: • If the borrowing is channeled into productive investments, it will increase the productivity of Americans and lead to higher future income. • However, if borrowing from foreigners is used either in an unproductive fashion or in order to increase current consumption, it will reduce future income.
Are Trade Deficits Bad? • Recently, a large portion of the capital inflow to the has been used to finance federal budget deficits. • This borrowing has facilitated high levels of federal spending without having to levy equivalent taxes. • As a result, current consumption has been higher, and investment lower, than would otherwise have been. • Borrowing of this type reduces the rate of capital formation and slows growth. • A family with financial problems cannot solve them by borrowing more in order to maintain its current level of consumption. • Neither can a nation.
Long-Run Equilibrium • When the macro-economy is in long-run equilibrium: • The interrelationships among the 4 key markets must be in harmony. • Resource prices, interest rates, exchange rates, and product prices will be such that, on average, firms will be just able to cover their costs of production, including a competitive return on their investment.