Download
1 / 9
90 likes | 199 Vues
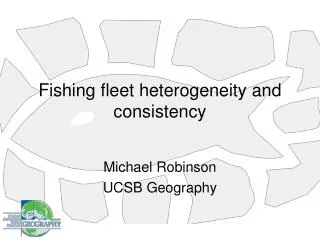
Fishing fleet heterogeneity and consistency. Michael Robinson UCSB Geography. Understanding fisherman behavior. Fishing is fraught with physical and financial risk and is undertaken in a constantly changing environment. Effort distribution within a fleet appears to be far from homogenous.

E N D
Fishing fleet heterogeneity and consistency Michael Robinson UCSB Geography
Understanding fisherman behavior • Fishing is fraught with physical and financial risk and is undertaken in a constantly changing environment. • Effort distribution within a fleet appears to be far from homogenous. • Smith and Wilen 2003, Mistiaen and Strand 2000 • Successful marine resource management requires an understanding of fisherman behavior. • Hilborn and Walters 1992
Fleet heterogeneity • What do I mean by this? • Some fishermen are better than others • Individuals are (fairly) consistent over time • Fishermen in different “segments” of a fleet have some distinctly different characteristics and behaviors.
Are fishermen consistent?Ranking average yearly CPUE over time… Pounds of urchin per hour per diver (Percentile relative to the entire fleet) *Fishermen with 6+ years of experience (from logbook data)
Are fishermen consistent?Ranking average yearly CPUE over time… Pounds of urchin per hour per diver (Percentile relative to the entire fleet) Number of legals per trap (Percentile relative to the entire fleet) *Fishermen with 6+ years of experience (from logbook data)
Are fishermen consistent?Ranking average yearly CPUE over time… Number of legals per trap (Percentile relative to the entire fleet) Pounds per boat (Percentile relative to the entire fleet) *Fishermen with 6+ years of experience (from logbook data)
Avg yearly CPUE ranks Avg yearly CPUE ranks ANOVA results for fishing fleets divided into four categories based on average yearly CPUE ranks. Avg yearly CPUE ranks
Fishing fleet modeling • Understand how “segments” within a fleet operate • Events per year, daily effort, catch per day • Predict how fleets will be affected by and/or respond to changing environmental and biological issues • Predict how fleets will be affected by and/or respond to changing management policies