Download
1 / 45
450 likes | 578 Vues
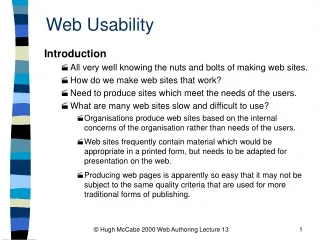
This presentation by Marti Hearst at the NEC Symposium 2000 addresses the critical need for improved usability in web design. With an alarming projection of 196 million new websites within five years, it highlights the rising usability gap exacerbated by a shortage of user interface professionals. Hearst discusses various strategies including automated usability evaluation methods, case studies like IBM's redesign, and the importance of information architecture. The talk introduces WebTANGO, a tool for assessing navigation and usability, showcasing empirical results and the benefits of early design intervention.

E N D
Automating Assessment of Web Site Usability Marti Hearst University of California, Berkeley NEC Symposium 2000
196M new Web sites in the next 5 years [Nielsen99] ~20,000 user interface professionals [Nielson99] The Usability Gap NEC Symposium 2000
A shortage of user interface professionals [Nielson99] The Usability Gap 196 M new Web sites in the next 5 years [Nielsen99] Most sites have inadequate usability [Forrester, Spool, Hurst] (users can’t find what they want 39-66% of the time) NEC Symposium 2000
Usability effects the bottom line IBM case study [1999] Spent $millions to redesign site • 84% decrease in help usage • 400% increase in sales • Attributed to improvements in information architecture NEC Symposium 2000
Usability effects the bottom line IBM case study [1999] Spent $millions to redesign site • 84% decrease in help usage • 400% increase in sales • Attributed to improvements in information architecture Creative Good Study [1999] Studied 10 e-commerce sites 59% attempts failed If 25% of these had succeeded -> estimated additional $3.9B in sales NEC Symposium 2000
Talk Outline • Web Site Design • Automated Usability Evaluation • Our approach • WebTANGO • Some Empirical Results • Wrap-up Joint work with Melody Ivory & Rashmi Sinha NEC Symposium 2000
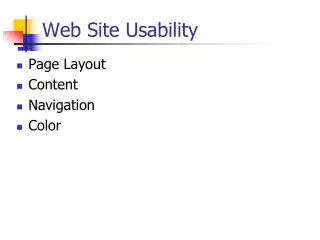
Web Site Design (Newman et al. 00) • Information design • structure, categories of information • Navigation design • interaction with information structure • Graphic design • visual presentation of information and navigation (color, typography, etc.) NEC Symposium 2000 Courtesy of Mark Newman
Web Site Design(Newman et al. 00) • Information Architecture • includes management and more responsibility for content • User Interface Design • includes testing and evaluation Courtesy of Mark Newman NEC Symposium 2000
Design Exploration Explore alternative design approaches (information, navigation, and graphic) Design Refinement Select one approach and iteratively refine it Production Create prototypes and specifications Web Site Design Process Start Discovery Assemble information relevant to project NEC Symposium 2000 Courtesy of Mark Newman
Iteration Design Evaluate Prototype NEC Symposium 2000
Usability EvaluationStandard Techniques • User studies • Have people use the interface to complete some tasks • Requires an implemented interface • "Discount" vs. Scientific Results • Heuristic Evaluation • Usability expert assesses guidelines NEC Symposium 2000
Automated UE • We looked at 124 methods • AUE is greatly under-explored • Only 36% of all methods • Fewer methods for the web (28%) • Most techniques require some testing • Only 18% are free from user testing • Only 6% for the web NEC Symposium 2000
Survey of Automated UE • Predominant Web methods • Structural analysis (4) • Guideline Reviews (11) • Log file analysis (9) • Simulation (2) NEC Symposium 2000
Existing Metrics • Web metric analysis tools report on what is easy to measure • Predicted download time • Depth/breadth of site • We want to worry about • Content • User goals/tasks • We also want to compare alternative designs. NEC Symposium 2000
Web TANGOTool for Assessing NaviGation & Organization • Goal: automated support for comparing design alternatives • How: Assess usability of the information architecture • Approximate information-seeking behavior • Output quantitative usability metrics NEC Symposium 2000
Benefits/Tradeoffs • Benefits • Less expensive than traditional methods • Use early in design process • Tradeoffs • Accuracy? • Validate methodology with user studies • Illustrate different problems than traditional methods • For comparison purposes only • Does not capture subjective measures NEC Symposium 2000
museum, history news, magazines government info Information-Centric Sites NEC Symposium 2000
Monte Carlo Simulation • Have a model of information structure • Have a set of user goals • Want to assess navigation structure • Compare alternatives/tradeoffs • Identify bottlenecks • Identify critically important pages/links • Check all pairs of start/end points • Check overall reachability before and after a change. NEC Symposium 2000
X One Monte Carlo simulation step for Design 1, Task 1. Simulation starts from the home page and the target information is at Renter Support. NEC Symposium 2000
X Monte Carlo simulation results for Design 1, Task 1. Simulation runs start from all pages in the site. Average Navigation times are shown for Tasks 2 & 3. NEC Symposium 2000
Monte Carlo Simulation • At each step in the simulation • Assume a probability distribution over a set of next choices. • The next choice is a function of: • The current goal • The understandability of the choice • Prior interaction history • The overall complexity of the page • Varying the distribution corresponds to varying properties of the links • Spot-check important choices NEC Symposium 2000
Monte Carlo Simulation • At each step in the simulation • Assume a probability distribution over a set of next choices. • The next choice is a function of: • The current goal • The understandability of the choice • Prior interaction history • The overall complexity of the page • Varying the distribution corresponds to varying properties of the links • Spot-check important choices NEC Symposium 2000
An Empirical Study: Which features distinguish well-designed web pages? NEC Symposium 2000
Methodology • Collect quantitative measures from 2 groups • Ranked: Sites rated favorably via expert review or user ratings • Unranked: Sites that have not been rated favorably • Statistically compare the groups • Predict group membership NEC Symposium 2000
Quantitative Measures • Identified 42 aspects from the literature • Page Composition (e.g., words, links, images) • Page Formatting (e.g., fonts, lists, colors) • Overall Page Characteristics (e.g., information & layout quality, download speed) NEC Symposium 2000
Word Count Body Text Percentage Emphasized Body Text Percentage Text Positioning Count Text Cluster Count Link Count Page Size Graphic Percentage Graphics Count Color Count Font Count Reading Complexity Metrics NEC Symposium 2000
Data Collection • Collected data for 2,015 information-centric pages from 463 sites • Education, government, newspaper, etc. • Data constraints • At least 30 words • No e-commerce pages • Exhibit high self-containment (i.e., no style sheets, scripts, applets, etc.) • 1,054 pages fit constraints (52%) NEC Symposium 2000
Data Collection • Ranked pages • Favorably assessed by expert review or user rating on expert-chosen sites • Sources: • Yahoo! 101 (ER) • Web 100 (UR) • PC Mag Top 100 (ER) • WiseCat’s Top 100 (ER) • Webby Awards (ER) & Peoples Voice (UR) NEC Symposium 2000
Data Collection • Unranked • Not favorably assessed by expert review or user rating on expert-chosen sites • Do not assume unranked = unfavorable • Sources: • WebCriteria’s Industry Benchmark • Yahoo Business & Economy Category • Others NEC Symposium 2000
Data Analysis • 428 pages • 214 ranked pages • 840 unranked pages • 214 chosen randomly NEC Symposium 2000
Findings • Several features are significantly associated with rated sites • Several pairs of features correlate strongly • Correlations mean different things in rated vs. unrated pages • Significant features are partially successful at predicting if site is rated NEC Symposium 2000
Significant Differences NEC Symposium 2000
Significant Differences • Ranked pages • More text clustering (facilitates scanning) • More links (facilitate info-seeking) • More bytes (more content facilitate info seeking) • More images (clustering graphics facilitates scanning) • More colors (facilitates scanning) • Lower reading complexity (close to best numbers in Spool study facilitates scanning) NEC Symposium 2000
Metric Correlations NEC Symposium 2000
Metric Correlations • Created hypotheses based on correlations: • Ranked Pages • Colored display text • Link clustering • Both patterns on all pages in random sample • Unranked Pages • Display text coloring plus body text emphasis or clustering • Link coloring or clustering • Image links, simulated image maps, bulleted links • At least 2 patterns in 70% of random sample • Confirmed by sampling NEC Symposium 2000
Metric Correlations NEC Symposium 2000
Colored display text Link clustering Rated Page NEC Symposium 2000
Body text emphasis Image links UnRated Page NEC Symposium 2000
Predicting Web Page Rating • Linear Regression • Explains 10% of difference between groups • 63% Accuracy (better at unranked prediction) NEC Symposium 2000
Predicting Web Page Rating • Home vs. Non-home pages • Text cluster count predicts home page ranking • 66% accuracy • Consistent with primary goal of home pages • Non-home page prediction • Consistent with full sample results • 4 of 6 metrics (link count, text positioning count, color count, reading complexity) NEC Symposium 2000
Future Work • New metrics computation tool • More quantitative measures • Process style sheets • Functional categories for pages • UI • Larger sample of pages • Validation studies with users NEC Symposium 2000
In Summary • Automated Usability Assessment should help close the Web Usability Gap • We can empirically distinguish between highly rated web pages and other pages • Web use simulation is an under-explored and promising new approach NEC Symposium 2000
Current Projects • Automating Web Usability (Tango) • Melody Ivory, Rashmi Sinha • Web Intranet Search (Cha-Cha) • Mike Chen, Jamie Laflen • Metadata in Search Interfaces (Flamenco) • Ame Elliot • Text Data Mining (Lindi) • Barbara Rosario • Visualization for daylighting design • Dan Glaser NEC Symposium 2000
More information: • http://www.cs.berkeley.edu/~ivory/web • http://www.sims.berkeley.edu/~hearst NEC Symposium 2000