Contributions of Material Flow Analysis to Addressing Critical Materials Challenges
This discussion at the IndEcol Expert Meeting, led by Daniel B. Müller, focuses on the importance of Material Flow Analysis (MFA) in addressing the complexities surrounding critical materials for a clean energy future. Understanding supply chain risks, ranging from resource availability to recycling effectiveness, is crucial. MFA can provide insights into the dynamics of material cycles, trade interactions, and intervention strategies, enabling proper evaluation of policies aimed at mitigating supply disruptions at both national and global levels.

Contributions of Material Flow Analysis to Addressing Critical Materials Challenges
E N D
Presentation Transcript
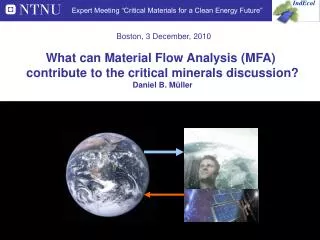
IndEcol Expert Meeting “Critical Materials for a Clean Energy Future” Boston, 3 December, 2010 What can Material Flow Analysis (MFA) contribute to the critical minerals discussion? Daniel B. Müller
Motivation Risk for supply chain disruptions and impacts are poorly understood. Difficulty to identify most effective interventions for specific elements(e.g., trade policy, substitution, recycling/reuse) Problem shifts are possible / likely, but poorly understood Hypothesis System approach based on MFA can support the evaluation ofcritical materials policies systems defined in space and time (not functional units)
Research opportunities for MFA • Characterize critical elements cycles- links between cycles of different materials- links between material cycles and energy and emissions- links between cycles of different countries (trade) • Analyze dynamics of cycles- drivers (lifestyle, penetration of new technologies, trade…)- roles of stocks- sensitivities • Develop scenarios- anticipate demand- anticipate supply (limits)- identify problem shifts (to other materials, energy, emissions)- test impacts of supply disruptions- evaluate strategies (e.g., interventions in different places of chain)- risk assessment • Data challenge!
0 20 40 60 80 100 120 2000 1000 0 3000 Reserve Base Reserves Mine Production 2005 World Tin Reserves and Mine Production, 2005 Static lifetime [years] R RB 15 30 CN 44 203 BR 500 600 MY PE 17 24 10 11 ID 26 53 BO RU 100 117 181 375 AU TH 262 308 140 160 PT Inf inf US ? ? VN ? ? CD 150 167 others 2239 thousand metric tons thousand metric tons Data source: USGS 2006
Tin cycle USA, 2000 [Gg] 0.2 0.1 ? 5 ? 0 ? 38 4 4.1 Steel Steel Ind 100 4.1 0.6 0.6 1.2 0.2 Use cans 4.3 7.3 7.9 8.2 8.4 7.3 Man cans 7.8 EOL Cans 8.8 Tinplate 10 Tinplatescrap Tinplate Obs.cans 1.4 Cans 0 0 Refining Detinning Mining Ore Use oth. 49 54 58 58 40 10.6 40 Ref. Tin Alloying Man oth EOL Oth 500 Alloy scrap Obs. others Alloys Others 43 8.9 6.6 15.5 12 0 0 29 3 Lithosph. Tailings Gvt Stockp Landfills 20 / 40 ? 60 1500 Literature Mass balance Own calculations / estimations
What could be done if tin supply was critical? 0.2 0.1 ? 5 ? 0 ? 38 4 4.1 Steel Steel Ind 100 4.1 0.6 0.6 1.2 0.2 Use cans 4.3 7.3 7.9 8.2 8.4 7.3 Man cans 7.8 EOL Cans 8.8 Tinplate 10 Tinplatescrap Tinplate Obs.cans 1.4 Cans 0 0 Refining Detinning Mining Ore Use oth. 49 54 58 58 40 10.6 40 Ref. Tin Alloying Man oth EOL Oth 500 Alloy scrap Obs. others Alloys Others 43 8.9 6.6 15.5 12 0 0 29 3 Lithosph. Tailings Gvt Stockp Landfills 20 / 40 ? 60 1500 Literature Mass balance Own calculations / estimations
What could be done if tin supply was critical? 0.2 0.1 ? 5 ? 0 ? 38 4 4.1 Steel Steel Ind 100 4.1 0.6 0.6 1.2 0.2 Use cans 4.3 7.3 7.9 8.2 8.4 7.3 Man cans 7.8 EOL Cans 8.8 Tinplate 10 Tinplatescrap Tinplate Obs.cans 1.4 Cans 0 0 Refining Detinning Mining Ore Use oth. 49 54 58 58 40 10.6 40 Ref. Tin Alloying Man oth EOL Oth 500 Alloy scrap Obs. others Alloys Others 43 8.9 6.6 15.5 12 0 0 29 3 Lithosph. Tailings Gvt Stockp Landfills 20 / 40 ? 60 1500 Option 1: Release industry and government stockpiles Literature Mass balance Own calculations / estimations
What could be done if tin supply was critical? 0.2 0.1 ? 5 ? 0 ? 38 4 4.1 Steel Steel Ind 100 4.1 0.6 0.6 1.2 0.2 Use cans 4.3 7.3 7.9 8.2 8.4 7.3 Man cans 7.8 EOL Cans 8.8 Tinplate 10 Tinplatescrap Obs.cans Tinplate 1.4 Cans 0 0 Refining Detinning Mining Ore Use oth. 10.6 49 54 58 58 40 40 Ref. Tin Alloying Man oth EOL Oth 500 Alloy scrap Obs. others Alloys Others 43 8.9 6.6 15.5 12 0 0 29 3 Lithosph. Tailings Gvt Stockp Landfills 20 / 40 ? 60 1500 Option 2: Utilize exported scrap domestically Literature Mass balance Own calculations / estimations
What could be done if tin supply was critical? 0.2 0.1 ? 5 ? 0 ? 38 4 4.1 Steel Steel Ind 100 4.1 0.6 0.6 1.2 0.2 Use cans 4.3 7.3 7.9 8.2 8.4 7.3 Man cans 7.8 EOL Cans 8.8 Tinplate 10 Tinplatescrap Tinplate Obs.cans 1.4 Cans 0 0 Refining Detinning Mining Ore Use oth. 49 54 58 58 40 10.6 40 Ref. Tin Alloying Man oth EOL Oth 500 Alloy scrap Obs. others Alloys Others 43 8.9 6.6 15.5 12 0 0 29 3 Lithosph. Tailings Gvt Stockp Landfills 20 / 40 ? 60 1500 Option 3: Element-specific recycling Literature Mass balance Own calculations / estimations
What could be done if tin supply was critical? 0.2 0.1 ? 5 ? 0 ? 38 4 4.1 Steel Steel Ind 100 4.1 0.6 0.6 1.2 0.2 Use cans 4.3 7.3 7.9 8.2 8.4 7.3 Man cans 7.8 EOL Cans 8.8 Tinplate 10 Tinplatescrap Tinplate Obs.cans 1.4 Cans 0 0 Refining Detinning Mining Ore Use oth. 49 54 58 58 40 10.6 40 Ref. Tin Alloying Man oth EOL Oth 500 Alloy scrap Obs. others Alloys Others 43 8.9 6.6 15.5 12 0 0 29 3 Lithosph. Tailings Gvt Stockp Landfills 20 / 40 ? 60 1500 Option 4: End-of-life recovery Literature Mass balance Own calculations / estimations
What could be done if tin supply was critical? 0.2 0.1 ? 5 ? 0 ? 38 4 4.1 Steel Steel Ind 100 4.1 0.6 0.6 1.2 0.2 Use cans 4.3 7.3 7.9 8.2 8.4 7.3 Man cans 7.8 EOL Cans 8.8 Tinplate 10 Tinplatescrap Tinplate Obs.cans 1.4 Cans 0 0 Refining Detinning Mining Ore Use oth. 49 54 58 58 40 10.6 40 Ref. Tin Alloying Man oth EOL Oth 500 Alloy scrap Obs. others Alloys Others 43 8.9 6.6 15.5 12 0 0 29 3 Lithosph. Tailings Gvt Stockp Landfills 20 / 40 ? 60 1500 Option 5: Mining landfills Literature Mass balance Own calculations / estimations
Example by-product element: indium (demand) • Uses of indium • Thin films:transparent and conductive coatings of indium tin oxide (ITO) for - liquid crystal displays (50% of In use!)- flat panel displays- touch screens- photovoltaic cells • smart windows • … Demand is rising sharply Recycling challenge: Very small quantities per unit, but many units
PGM Metal families – most precious & special metals are coupled to major metals production • supply of many “technology metals” is price-inelastic: • Increased demand can only be met by primary production if demand for major metal rises accordingly • Short term demand surges lead to price peaks (see Ir, Ru, In) • Effective recycling important for supply security Source: Ch. Hagelueken(Umicore)
Fe mining Steel prod. Steel prodmanufact. Steel use Steel EOLmgt. EAF Slag Zn mining Zn prod Zn productsmanufact. Zn pr. use Zn EOLmgt. Zn Slag / dust In refining In productsmanufact. In pr. use In EOLmgt. Landfills In loss in plating of LCDs: 75% Example: Indium linkages Indium supply needs to be studies by analyzing zinc cycle Indium cannot be extracted from a pool, but from a flow (zinc slag/dust) Similar to scrap! But with few substitutes.
Global Bauxite Production, 2007 Data Source: USGS, 2009 Graph: Liu, 2009
Global aluminium production chain over time Bauxite Aluminium Alumina a.1930 a.1930 b.1970 b.1970 b.1971 c.2007 c.2007 c.2007 Source: Liu 2010
Global trade of Al containing products along value chain, 2006 countries ranked by per-capita GDP Norway USA Jamaica China Guinea Johansen 2010
Data challenge • Data availability for critical materials is critical! • Data provided by governments are usually not integrated into a systems context. limited potential to inform policies and own measurement programs • a growing number of universities spend a lot of time compiling data, with different degrees of transparency – waste of brain power and money small incentives for data sharing… • Coordinated effort needed! UN Statistics: harmonized… Manuf Use EOLM Prod Geological Surveys National accounts Lithosp Landfills, other repositories