Download
1 / 33
330 likes | 467 Vues
Energy Charting and Metrics (ECAM) Tool Introduction February 14, 2012. Bill Koran, P.E. Director of Energy Analytics NorthWrite, Inc. Intellectual Property Data/Application Management - Building information modeling (BIM) - Application Integration Framework

E N D
Energy Charting and Metrics (ECAM) ToolIntroductionFebruary 14, 2012 Bill Koran, P.E. Director of Energy Analytics NorthWrite, Inc.
Intellectual Property • Data/Application Management • - Building information modeling (BIM) • - Application Integration Framework • - Enterprise Management Platform • - OEM Platform/Portal • Analytics • - Modeling • Prediction • Benchmarking • Network Operations Center • High volume, scalable hosting infrastructure • Wireless communications/hardware • Remote system data collection • Remote building control (Demand Response) • Green Systems • - Automated Energy Star Rating • - Lobby kiosk/portal view • Reporting • Utility Bill Analysis • - Bill capture, dissection, aggregation • Energy Program Management • - Project and task tracking • - Metrics and program measurement • Collaboration • - B2B Content Subscriptions • - Partners, Providers, Customers NorthWrite is a web-based technology company focused on supporting a global network of strategic partners. • Business formed in 2001 • Over 2,000 meters being monitored, growing by 50% in next 2 months • Management team ex-Honeywell • Offices: Minneapolis, Portland OR. • Software as a Service • Robust database back end • User-friendly web interface • Focus: Energy • Markets: Commercial; Multi-location enterprise • Channel: Direct, national partner network, OEM’s
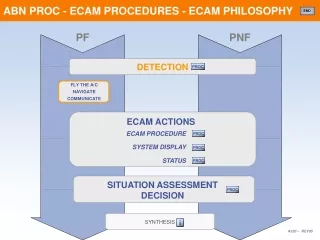
NorthWrite Energy Information Management System Architecture Data Warehouse BMS/SCADA Data Other Building Systems (Fire, Security, etc.) Weather Data Logger Data User/Activity Data Application Data Accessed via Ethernet/Web Wireless Email TCP/IP EIMS Server(s)
ECAM—My View • Desktop Energy Information System • Energy Data Organizer • Energy Data Summarizer/Aggregator • Energy Data Analysis Tool • Now becoming an M&V Platform Over 8,000 lines of code Over 200 I/O controls
ECAM Background • Initial building blocks and core code based on automation I developed for my personal use: • Disaggregation of Timestamps • Naming of fields • Automated chart creation and formatting • Time-series charts • Scatter charts • Calendar charts • 3d charts • Conversion of utility meter data tables to list format • A notable feature is the provision of scatter charts based on PivotTables
ECAM Background • Formal development funded by NBI, NEEA and California (CEC, PIER, CCxC) • FREE Excel based tool • Currently Version 2.0 • Excel 2003/2007/2010 • Many more metrics, charts, and features • Supports PNNL “Re-Tuning” process • M&V enhancements in development,funded by NEEA.
ECAM Incorporates Prior Research • Chart Types based on the PIER report, Web-based Energy Information Systems for Energy Management and Demand Response in Commercial Buildings (2003) http://www.energy.ca.gov/2003publications/CEC-500-2003-097/CEC-500-2003-097F-A13.PDF • Point Naming convention from A Specifications Guide for Performance Monitoring Systems http://cbs.lbl.gov/performance-monitoring/specifications/pdf/PM%20Spec%20Guide%20Version%201_2007-03-23.pdf
LBNL EIS Survey June 2009Data Visualizations • X-y scatter plotting was not a common or standard visualization capability in 2003, and while it has grown some it remains an under-supported feature in today’s EIS solutions. • Given their power in facilitating diagnostic troubleshooting it is discouraging that only half the tools surveyed include x-y plotting.
ECAM Charting Features, partial list • Time series • X-Y (scatter charts from PivotTable!) • Daily load profile • 3D and Surface • Calendar load profiles • Box Plot Load Profiles • Schedule Input Confirmation
ECAM Metrics • Daytype and Occupancy Metrics • Occupancy and Month-Year combination • Daytype and Month-Year combination • Frequency Distributions and Histogram • Data Summaries • Ratio of typical low to typical high demand • Percentiles: Max, 95, 90, 75, median, 25, 10, 5, minimum • Std. Deviations: Average, ±1, ±2, ±3
ECAM Features • Automatic data pre-processing • Normalization • W/SF • cfm/SF • kW/ton • gpm/ton • Equipment status inferred from current or kW • Easy aggregation to totals/averages • Hourly • Daily • Monthly • Annual
ECAM M&V, In Development • Scatter charts for daily totals/averages • Scatter charts for hourly totals/averages • Load Profile by Weekday (like RTU calculator, but with user choice of data point) • Daily scatter charts for each day of weekso users can easily see which days are similar • Easy ad-hoc definition of daytypes like RTU calculator • ‘Hourtypes’ based on input schedule
ECAM M&V, In Development • Linear regression. • Change-Point regressions • 3-parameter • 4-parameter • 5-parameter • 6-parameter • Combine hourtype/daytype models into complete model
ECAM M&V, In Development • Uncertainty Analysis • Residuals Analysis Charts • Annual extrapolation using TMY3 weather datalike RTU calculator
Load Duration Curve • Cumulative percentage of time at different loads. • For time period and daytype selected
Load Frequency/Histogram • Actual time at different loads • For time period and daytype selected
ECAM Links • ECAM Spreadsheet:file://HQ5F01/ESB/ECAM/ECAM_v2pt0dev61.xla • ECAM Description: file://HQ5F01/ESB/ECAM/CommercialBuildings_ECAM_100311.pdf • ECAM Users Guide file://HQ5F01/ESB/ECAM/ECAM%20v2%20Users%20Guide%20draft.pdf • PNNL Retuning web site http://www.pnl.gov/buildingretuning/index.stm • Building Retuning Traininghttp://retuningtraining.labworks.org/training/lms/ • California Commissioning Collaborative ECAM web sitehttp://cacx.org/PIER/ecam/
ECAM Can FacilitatePowerful Analyses “Bill, These plots are very telling… I wish I had some of these figures earlier. I just completed a textbook… wherein I would have liked to have included some of these figures.” T. Agami Reddy, Ph.D., Arizona State University
A New Resource Applied Data Analysis and Modeling for Energy Engineers and Scientists, by T. Agami Reddy, Ph.D.Springer Science+Business Media 2011.http://www.springer.com/energy/energy+efficiency/book/978-1-4419-9612-1