Download
1 / 15
150 likes | 305 Vues
A Semi-Analytic Model of Type Ia Supernova Turbulent Deflagration. Kevin Jumper Advised by Dr. Robert Fisher May 3 , 2011. Review of Concepts. Type Ia supernovae may be “standard candles” Progenitor is a white dwarf in a single-degenerate system

E N D
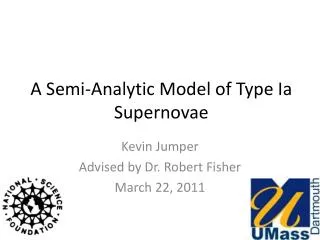
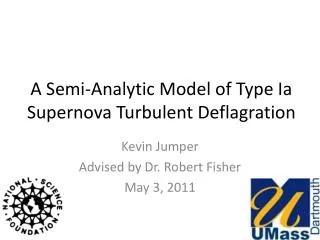
A Semi-Analytic Model of Type Ia Supernova Turbulent Deflagration Kevin Jumper Advised by Dr. Robert Fisher May 3, 2011
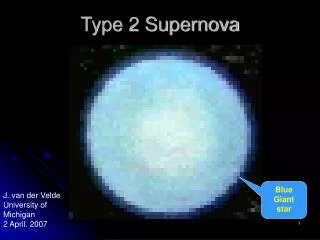
Review of Concepts • Type Ia supernovae may be “standard candles” • Progenitor is a white dwarf in a single-degenerate system • Accretion causes carbon ignition and deflagration • Fractional burnt mass is important for describing deflagration Credit: NASA, ESA, and A. Field (STScI), from BrigetFalck. “Type Ia Supernova Cosmology with ADEPT.“ John Hopkins University. 2007. Web.
The Semi-Analytic Model • One dimensional – a single flame bubble expands and vertically rises through the star • The Morison equation governs bubble motion t = time R = bubble radius ρ1 = bubble (ash) density ρ2 = background star (fuel) density V = bubble volume g = gravitational acceleration CD = coefficient of drag • Proceeds until breakout
The Semi-Analytic Model (Continued) • The coefficient of drag depends on the Reynolds Numbers (Re). Coefficient of Drag vs. Reynolds Number 3.0 2.5 2.0 Coefficient of Drag 1.5 • Δx is grid resolution • Higher Reynolds numbers indicate greater fluid turbulence. 1.0 0.5 0.0 0 20 40 60 100 120 140 80 Reynolds Number
The Three-Dimensional Simulation • Used by a graduate student in my research group • Considers the entire star • Proceeds past breakout • Grid resolution is limited to 8 kilometers • Longer execution time than semi-analytic model Credit: Dr. Robert Fisher, University of Massachusetts Dartmouth
Project Objectives • Analyze the evolution of the flame bubble. • Determine the fractional mass of the progenitor burned during deflagration. • Compare the semi-analytic model results against the 3-D simulation. • Add the physics of rotation to the semi-analytic model.
Comparison with 3-D Simulations (Updated) Log Speed vs. Position • There is still good initial agreement between the model (blue) and the simulation (black). • The model’s bubble rise speed is increased due to a lower coefficient of drag. 3 2 Log [Speed (km/s)] 1 0 800 1200 1600 0 400 Position (km)
Comparison with 3-D Simulations (Updated) Log Area vs. Position • The bubble’s area is decreased in the model, as it has less time to expand. • Now the model and simulation begin to diverge at about 200 km. 8 7 6 Log [Area (km^2)] 5 4 3 400 800 1200 1600 0 Position (km)
Comparison with 3-D Simulations (Updated) • The model has greater volume until an offset of about 600 km. • The early discrepancy between the volume of the model and simulation is much smaller. Log Volume vs. Position 12 11 10 9 8 Log [Volume (km^3)] 7 6 5 4 400 800 1200 1600 0 Position (km)
Comparison with 3-D Simulations (Updated) Fractional Burnt Mass vs. Position • As predicted, the model’s fractional burnt mass is higher (about 3%). • The simulation predicts about 1% at breakout. • We still need to refine the model. 0.040 0.035 0.030 0.025 Fractional Burnt Mass 0.020 0.015 0.010 0.005 0.000 0 400 800 1200 1600 Position (km)
Adding Rotation to the ModelSpherical Coordinates • Cartesian coordinates are inconvenient for rotation problems. • r = radius from origin • θ = inclination angle (latitude) • Φ = azimuth angle (longitude) • The above conventions may vary by discipline. Weisstein, Eric W. "Spherical Coordinates." From MathWorld--A Wolfram Web Resource. http://mathworld.wolfram.com/SphericalCoordinates.html Image Credit: Wikipedia
Adding Rotation to the ModelForce Equation The rotating star is a noninertial reference frame, which causes several “forces” to act upon the bubble. F’ = Fphysical + F’Coriolis + F’transverse + F’centrifugal– mAo All forces except Fphysical depend on the motion of the bubble relative to the frame. Credit: Fowles and Cassiday. “Analytical Mechanics.” 7th ed. Thomson: Brooks/Cole. 2005. Print.
Adding Rotation to the ModelSummary of Forces • Fphysical: forces due to matter acting on the bubble • F’Coriolis: acts perpendicular to the velocity of the bubble in the noninertial system • F’transverse: acts perpendicular to radius in the presence of angular acceleration • F’centrifugal: acts perpendicular and out from the axis of rotation • mAo: inertial force of translation Credit: Fowles and Cassiday, page 199 Credit: Fowles and Cassiday. “Analytical Mechanics.” 7th ed. Thomson: Brooks/Cole. 2005. Print.
Future Work • Try to narrow the discrepancy so that the model and simulation agree within a factor of two • Program the effects of rotation into the semi-analytic model
Questions? A Semi-Analytic Model of Type Ia Supernovae