Download
1 / 22
220 likes | 347 Vues
A Semi-Analytic Model of Type Ia Supernovae. Kevin Jumper Advised by Dr. Robert Fisher March 22, 2011. Review of Important Terms. White Dwarf Chandrasekhar Limit Type Ia Supernovae Flame Bubble Self-Similarity Deflagration Breakout GCD Model.

E N D
A Semi-Analytic Model of Type Ia Supernovae Kevin Jumper Advised by Dr. Robert Fisher March 22, 2011
Review of Important Terms • White Dwarf • Chandrasekhar Limit • Type Ia Supernovae • Flame Bubble • Self-Similarity • Deflagration • Breakout • GCD Model
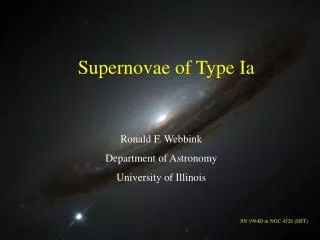
A Visualization of a GCD Type Ia Supernova Credit: Dr. Robert Fisher
Project Objectives • Determine the fractional mass burned during deflagration. • Analyze the evolution of the flame bubble. • Compare the results against other models and simulations.
Preliminary Results For the following conditions: Initial Mass: 1.360 solar masses Initial Radius: 2,500 kilometers • Breakout occurs in about 1.2 seconds. • Fractional burnt mass is generally too high. • Breakout velocities are around 2,600 km /s. • Maximum velocity is attained shortly before breakout. • Bubble self-similarity appears to be supported.
Preliminary Results: Bubble-Self Similarity • We saw the near-independence of breakout velocity from bubble conditions. • This seemed to justify our spherical assumption for the model.
Comparison to 3-D Simulation Results • Dr. Fisher asked me to compare my model to David’s simulation. • Initial Conditions of Simulation • Progenitor Mass: 1.366 solar masses • Progenitor Radius: ≈ 2,000 km • Initial Bubble Radius: 16 km • Initial Bubble Offset: 40 km
Recalibrating the Model’s Bubble Radius • Initially, the simulation had a greater fractional burnt mass. • This was a consequence of the resolution of the simulation. • To start with the same fractional burnt mass, the model’s bubble radius had to be changed to 24 km.
Observations • There is relatively good agreement with the simulation’s velocities. • The area and volume diverge from the simulation over time. • The model area and volume obey power laws. • There is a significant discrepancy between the fractional burned mass of the model and simulation.
Testing the Spherical Geometry of the Simulation • The above equation is satisfied if the geometry of the bubble is spherical. • We concluded that the simulation’s bubble was non-spherical.
Testing the Spherical Geometry:Ratio versus Time Credit: David Falta
Comparing to the Tabular Results • The model’s code also has a routine to read in data about the progenitor instead of calculating it. • However, the same general behavior as the semi-analytic model was observed. • There was also a greater discrepancy in the fractional mass burnt.
Varying the Coefficient of Drag • Dr. Fisher hypothesized that the coefficient of drag might be too high in the model. • I was instructed to repeatedly halve the coefficient of drag and see if we could obtain the simulation’s fractional burnt mass. • This is also affected by the Reynolds number, which describes turbulence.
Effect of Changing Reynolds Numbers/Drag Coefficients Credit: Milton van Dyke
Questions? A Semi-Analytic Model of Type Ia Supernovae