Download
1 / 21
210 likes | 438 Vues
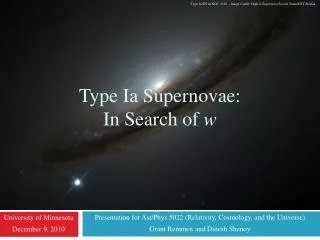
Type Ia SN in NGC 4526 – Image Credit: High-Z Supernova Search Team/HST/NASA. Type Ia Supernovae: In Search of w. Presentation for Ast /Phys 5022 (Relativity, Cosmology, and the Universe) Grant Remmen and Dinesh Shenoy. University of Minnesota December 9, 2010. Why w?.

E N D
Type Ia SN in NGC 4526 – Image Credit: High-Z Supernova Search Team/HST/NASA Type Ia Supernovae: In Search of w Presentation for Ast/Phys 5022 (Relativity, Cosmology, and the Universe) Grant Remmen and DineshShenoy University of Minnesota December 9, 2010
Why w? • The expansion history of the Universe may be parameterized in a number of ways. Why is the equation-of-state parameter, w, useful? • Recall, w = P/ρc2, characterizing a given component of the universe: • w = 0 for matter • w = 1/3 for radiation • “w” = –1/3 for curvature • w = –1 for cosmological constant, Λ • By the Friedmann equation, for w < –1/3, acceleration occurs. • For most reasonable energy components, w ≥ –1 (this is called the null energy condition in relativity). However, certain explanations for dark energy, such as “phantom energy” (big rip) and some scalar field theories, allow for values of w < –1. • Slow-rolling scalar fields (similar to inflation) produce values of w near –1 that may change in time. • In total, constraining w allows certain explanations of dark energy to be ruled out or supported.
Luminosity Distance: Probe the expansion history of the Universe: Standard candles provide a method of finding luminosity distance (DL) as a function of redshift (z). Recall the formula for angular diameter distance: Relation between DLand DA: Friedmann equation: Putting the above together, we obtain (Miknaitis et al. 2007):
Type Ia Supernovae Type Ia designation denotes spectral characteristics: the lack of H and He features and presence of an absorption trough at 6150 Å. • What are they? • Carbon-oxygen white dwarf near Chandrasekhar limit (limit of electron degeneracy pressure), approximately 1.4 M⨀. • WD accretes matter from its companion star, triggering a runaway nuclear explosion that obliterates the star. • The standardization of the masses of Type IaSNe helps the light curves from these supernovae to be fairly uniform. • The lack of H and He absorption lines is due to the white dwarf’s lack of atmosphere. • Typical maximum brightness occurs around 20 days after the start of the SN, with bolometric magnitude of approximately –19.3 (Hillebrandt & Niemeyer 2000), several billion times brighter than the Sun. Simulation credit: DOE NNSA ASC/Alliance Flash Center at the University of Chicago
Artist’s Rendering of SN Ia Animation credit: European Southern Observatory/M. Kornmesser
Light-Curve Fitting • Light-curves of SNeIa share a similar characteristic shape, but are not exactly the same. • Procedures developed to fit the light-curves to a standard curve, allowing for the determination of luminosity distances based on the observed flux: • Stretch correction(Perlmutter et al. 1997, Perlmutter 2003) • Other time-dependent parametric approaches • Fitting light-curve to library of close-by SNeIa (Tonry et al. 2003) • Multicolor light-curve shape fitting: MLCS2k2 program (Jha et al. 2007)
Stretch Correction: Simplest Fitting Method Compare corrected observed flux with the flux expected from a “standard” SN Ia 10 pc away (i.e. absolute magnitude) to calculate luminosity distance. (top) Most Sne Ia fall on the central yellow band. Brighter SNe have a longer duration than dimmer SNe. (bottom) When the curves are stretched in time (and the brightness is corrected accordingly), the curves match well. Figure credit: Perlmutter 2003/Physics Today
Approach used in the ESSENCE Survey: MLCS2k2 Light Curve Fitter • More complex than the simple stretching method • Provides templates for light curves in various spectral bands • Accounts for: • Extinction of light in the host galaxy (i.e. absorption by dust) • K-correction (adjustment of the magnitude of a redshifted object observed through a filter, in order to compute bolometric flux) • Extinction in the Milky Way • Parameters: • Δ, encompassing intrinsic color, rate of decline, and peak brightness of light-curve • AV , host galaxy extinction of V-band light • μ, the distance modulus: • Despite the added complexity, the basic concept for light curve fitting to determine DL is the same as that of the simple stretching method.
Results: ESSENCE Supernova Survey (Miknaitis et al. 2007, Wood-Vasey et al. 2007) • Identified over 100 Type Ia SNe at moderate redshift (0.1 to 0.78). • Flat Universe, with and • Data may be combined with other SN surveys to obtain constraints on cosmological parameters (Davis et al. 2007, Riess et al. 2007, Wood-Vasey et al. 2007). • We can compare these results to two extremes: Einstein-deSitter (ΩM = 1) and Lambda-only (ΩΛ = 1) universes: • Einstein-deSitter: • Lambda-only:
Luminosity Distance Luminosity Distance vs. Redshift for SNe Ia
Distance Modulus: Distance Modulus vs. Redshift for SNe Ia
Residuals: Δμ = μobs – μfit Discrepancy in Distance Modulus vs. Redshift for SNe Ia
Constraints on ΩM and ΩΛ Figure Credit: Wood-Vasey et al. 2007 Constraints on ΩM, ΩΛ, and w, based on the combined data of the ESSENCE survey, Supernova Legacy Survey (SNLS), the “gold” sample of Riess et al. (2004), and baryonic acoustic oscillations.
Expansion History of the Universe h = 0.698 Best-fit model: χr2 = 1.04 Pr(χr2 > 1.04) = 0.35 Einstein-deSitter: χr2 = 7.27 Lambda-only: χr2 = 1.97 a Acceleration Deceleration
Sources of error in w • w < – ⅓ accelerating universe • w = – 1 Λ-dominated universe specifically • Random statistical error: increase sample size • Systematic error: improve or change techniques • ESSENCE & SLS combined: w = –1.07 ± 0.09 (stat 1σ) ± 0.13 (sys)
Systematic Error Sources • 16 possible sources of systematic error • Equipment-based sources (e.g., CCD linearity) • Astrophysical causes: • Host galaxy dust extinction & intrinsic color of SNe Ia • A “Hubble bubble” ?
Reddening & Intrinsic Color • Sources of reddening: Host Galaxy, Milky Way • Milky Way reddening – tabulated values available • Host Galaxy reddening – correction applied to color index B-V
B – V (Color Index) • B ~ 4200 Å (blue light) • V ~ 5200 Å (yellow-green light) • Magnitude system (counterintuitive!): • dimmer light ↔ higher magnitude (e.g., +15 or +21) • brighter light ↔ lower magnitude (e.g., +1 or -0.5) • B – V ≡ 0 @ Teff = 10,000 K • B – V ~ 1 @ 35 days after max brightness • For z ≥ 0.5, use R – I index instead (red to near-IR)
A “Hubble Bubble” ? • Larger local value of H lower flux received • Observed for 0.008 < z < 0.02 • Zehavi et. al. (1998) – within 100 Mpc, H greater by about 6.5% for flat ΩM = 1 (Einstein-de Sitter) • Jha et. al. (2007) – H greater by about 4.5% for ΩM = 0.3 and ΩΛ = 0.7
A “Hubble Bubble” ? (continued) • Possible solution: Increase sample size of nearby (z < 0.015) SNe Ia (Jha et. al. 2007) • Possible solution: exclude SNe Ia with z < 0.015 (Conley et. al. 2007) – adopted by ESSENCE • Further recommendation: exclude SNe Ia with z < 0.035 to reduce systematic error in ΩΛ to 0.1% (Sinclair et. al. 2009)
References Conley, A., et al. 2007, 664, L13 Davis, T. M., et al. 2007, ApJ, 666, 716 Hillebrandt, W., & Niemeyer, J. 2000, ARA&A, 38, 191 Jha, S., Riess, A. G., & Kirshner, P. 2007, ApJ, 659, 122 Miknaitis, G., et al. 2007, ApJ, 666, 674 Perlmutter, S., et al. 1997, BAAS, 29, 1351 Perlmutter, S., 2003, Physics Today, 56, 4, 53 Riess, A. G., et al. 2004, ApJ, 607, 665 Riess, A. G., et al. 2007, ApJ, 659, 98 Sinclair, B., et al. 2009, ApJ, 718, 1445 Tonry, J. L., et al. 2003, ApJ, 594, 1 Wood-Vasey, W. M., et al. 2007, ApJ, 666, 694 Zehavi, I., et al. 1998, ApJ, 503, 483