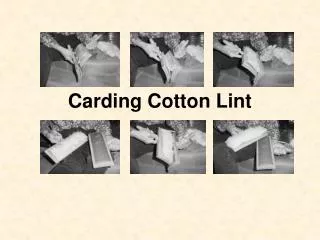
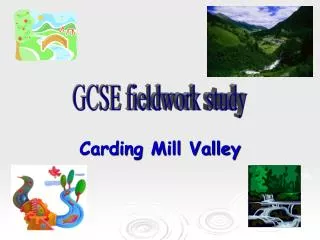
Carding Mill Valley
GCSE fieldwork study. Carding Mill Valley. Key Question: How do the processes of erosion, transportation and deposition change downstream in Carding Mill Valley? . This question is the central part of your project and these key words need to be referred to continually.

Carding Mill Valley
E N D
Presentation Transcript
GCSE fieldwork study Carding Mill Valley
Key Question: How do the processes of erosion, transportation and deposition change downstream in Carding Mill Valley? This question is the central part of your project and these key words need to be referred to continually. You need to be aware that we are looking at change over distance! This is the question that you will refer back to in your conclusion.
So…… • To start the write up you need: • An opening paragraph or two to explain why we went • the overall aim of the trip • the hypothesis questions you have chosen to prove the aim. Be aware…. You must not write in the first person! “I did this, I went there” All photos, maps, graphs must be linked into the text.
Hypotheses The hypotheses below are very important. You will be expected to test each of these hypotheses and provide data to prove or disprove each one in your write up. Hypothesis 1The river, its channel and its valley get wider as you travel downstream. Hypothesis 2The cross-sectional area and the velocity of the river increases as you travel downstream. Hypothesis 3The gradient of a river decreases as you travel downstream.Hypothesis 4 The size of the bedload decreases and its roundness increases as you travel downstream. Hypothesis 5 The Land Use of the Valley Changes as you go downstream.
Change downstream The main focus of your coursework is to investigate changes in the river and valley as you travel downstream. Upper Valley Lower Valley Gradient of valley Land uses Channel width and depth Vertical erosion Think about key processes and words like: Bedload size and roundness Lateral erosion Velocity
Location/ where we went! What to include…… • Map/s – which show area and survey sites. These must be fully annotated using geographical terminology. (see example) • Photos of the area surveyed – with labels. (see examples) • Paragraph of writing to explain the place you have visited.
Ordnance Survey map of area surveyed. Use a copy of this or a map from Multimap website that shows contour lines in detail. Annotations need to be detailed, as shown, and use geographical terminology to prove your knowledge.
This map is the base map for the survey areas. You will use it later to mark on the different land uses. But it can be used here to show the river system and some survey points, as well as the relief around the river system.
This is a good map to include as it shows the development of the river system and the location of the 5 survey points. US1. LS2. US2. LS1. But remember!!! All maps need to be numbered and referred to in the text e.g.” as can be seen on map 1” S P 5
How to use a photograph in the write-up – quality, detailed annotations; numbering of photograph for referring to in the text.
Aerial view of the Carding Mill Valley How can this be used in your project? In this photo you can easily see the mountains of the Long Mynd which form the watershed and catchment area for the Carding Mill valley. The steep gradient which the river flows down can be identified. As can the change in land use down the valley. These ideas can be used in your annotations of a photograph
Climate Graph. What do you think is the significance of a climate graph in this piece of work? Draw a climate graph of these figures – remember? You were taught this in Y7!! Average figures! Temperature range = 14 C Total rainfall = 771 mm Annotate your climate graph! Research this years weather and climate statistics so far by visiting www.metoffice.gov.uk/climate/uk Here you will find a report on the weather of the preceding months which might be useful in your explanation. Has recent weather affected flow in river? Now you need to explain the significance of this information – how does it relate to discharge levels?
Remember?? Bar graph for rainfall. Line graph for temperature
Methodology • Need to refer to the maps here with reference to the different sites you have taken measurements at. • Need to refer to all the different measurements you have made – explain what you did, what equipment was used • Need to evaluate the experiments and equipment that you used. Could do all this with an opening paragraph and a table.
Use as much geographical vocabulary as possible Don't waste time! Stick to deadlines Come to extra help sessions