Fish Passage Effectiveness
Fish Passage Effectiveness. It’s Not Just Counting Fish Studies on the Deerfield River John Ragonese, FERC License Mgr. USGen New England Inc. FERC Fish Passage Workshop 11-13-03. Fish Passage Requirements. Deerfield River Project No. 4, No. 3, No.2 Developments


Fish Passage Effectiveness
E N D
Presentation Transcript
Fish Passage Effectiveness It’s Not Just Counting Fish Studies on the Deerfield River John Ragonese, FERC License Mgr. USGen New England Inc. FERC Fish Passage Workshop 11-13-03
Fish Passage Requirements • Deerfield River Project • No. 4, No. 3, No.2 Developments • Settlement Agreement 12-05-94 • License issued 04-04-97 • DS Passage within 2 years • DS Passage 4/1-6/15 & 9/15 – 11/15 • Upstream Passage at No.2 based upon returns
Downstream Passage Devices • Order Approving plans 8-21-98 • Began operating 4-1-99 • No. 4 Dam New surface collection device, migrant pipe, plunge pool and flume • No. 3 Dam Modified sluice gate to bypass • No. 2 Dam New surface gate and flume to dam base
Lower Deerfield River 19 20 Turners Falls Dam DRP No. 4 18 17 Rt. 2 Shelburne Falls 16 I-91 Buckland 15 Gardners Falls Dam Greenfield 14 12 2 1 DRP No. 3 Turners Falls 13 3 Bardwell Ferry Bridge 4 DRP No. 2 11 10 5 Schneck Brook Bardwell Ferry Monitor Station 9 6 8 7 2 N 0 Miles Bear River Old Deerfield South River Connecticut River Deerfield River Deerfield River Project Developments, study area, downstream monitor stations, Gardners Falls Project, and approximate river mile locations.
Deerfield River DRP No. 4 Dam N Monitored Area DRP No. 4 Powerhouse Fishway Monitored Area Rt. 2 Intake Forebay 0 2000 ft Deerfield River Project No. 4 Development layout and radio telemetry monitor locations. Deerfield No. 4 Development
Bridge St. DRP No.3 Dam DEERFIELD Fishway N Monitored Areas RIVER DRP No.3 Powerhouse 0 ft 500 Intake Canal Deerfield River Project No. 3 Development layout and radio telemetry monitor locations. Deerfield No. 3 Development
Monitored Area 3 1 2 N Monitored Area Fishway 0 1 Mile Deerfield No. 2 Development Monitored Area Gardners Falls Project Dam Powerhouse DRP No. 2 Deerfield River Project No. 2 Development layout and radio telemetry monitor locations.
Evaluation Approach • Iterative • …but not by choice • Used Radio Tagging to measure • … and then some (to solve and determine improvement options) • Believe we are close to succeeding…
% Effectiveness Fishway effectiveness is a measure of how well the fishway attracts emigrating smolts. E = F/A, where E = Effectiveness of the fishway; F = the number of tagged smolts that used the fishway; A = those tagged smolts available in the project vicinity just upstream (i.e., the total of the number of fish passed through the fishway, turbines and those fish detected near the fishway but that did not pass by any route). Radio tagging metrics
% Safe Passage Safe Passage through each route was calculated as: S = s/P, where S = safe passage between monitoring locations; s = the number of smolts that is passed via a particular route and were detected at downstream monitor locations or manually located downstream; and P = the total number of tagged smolts that used each available route at a particular development. Could only be estimated in a general manner since tagged smolts were not recaptured for examination after passage. Tagged fish were monitored for presence at points well downstream of each dam. Length of river reach between the dam and the downstream monitor needs to be considered as to the effect predation could have on the results. Radio tagging metrics
Studies and Modifications Chronology • 1999 • Completed Construction of Facilities • 1999 Radiotag telemetry ( all 3 dams) • Radiotagging Results • No.4 - 59% Effective; Safe passage 85% • No. 3 – 78% Effective; Safe passage 96% • No. 2 – 20% Effective; Safe Passage 55%
Studies and Modifications Chronology 2000 Modifications • No. 4 - 1” Bar Racks installed in front of bulkhead • No. 4 and No. 3 - Log boom relocated • No. 2 - Flow Inducer installed, minimum flow unit switched to unit nearest fishway • No. 2 - Flume Support Struts reduced to minimal number, log boom removed
Studies and Modifications Chronology 2000 Evaluations • Flow Inducer CFD modeling • Floy-tag visual observation at No. 2 • Radiotag telemetry (all 3 dams)
Studies and Modifications Chronology 2000 Evaluations • Flow Inducer Results • Surface flows fields were modified and directed • Insufficient depth above intakes restricted depth of affected surface flow inducing field • At 33%+ station load intake velocities dominated flow fields and velocities • Radio tagging Results • No.4 - 28% Effective; Safe passage 74% • No. 3 – 41% Effective; Safe passage 53% • No. 2 – 15% Effective; Safe Passage 71%
Studies and Modifications Chronology 2001 Modifications None 2001 Evaluations Extensive CFD modeling of flows approaching all 3 dams; follow-up modeling Spring 2002 • Tested at single unit and 3-unit operation • No. 2 tested at higher 10 foot pond • CFD modeling not performed for higher spill or inflatable dam configuration and passing spill over crest
CFD Flow EvaluationConclusions • Flow vectors approaching intakes are not affected by presence of bypass option unless immediately in front of bypass. • Velocities too high for fish to overcome when in the field in front of intake racks.
Studies and Modifications (cont.) 2002 Modifications • Altered Operation to increase flows through fishways; reducing generation from 6p-7a • No. 4 - Moved deep trash boom away from fishgate • No. 3 Modified trashracks; removed trashboom • No. 2 Increased depth of pond 6’ • No. 2 Increased flow through fishgate • No. 2 Sluice gate option studied
Studies and Modifications (cont.) 2002 Evaluations • Radiotag telemetry (all 3 dams); operations scenarios evaluated • No. 3 Underwater camera assessment to determine stream-reared migration timing • 2002 Fall PIT Tagging upstream tributaries for Spring 2003 evaluation
Studies and Modifications (cont.) 2002 Evaluations Results • No. 3 Underwater camera assessment • Poor visibility at night (infrared); good during day • 28 smolts identified over 2880 continuous hours • Seasonality – temperature 8-12 C; 5/10-5/20; high natural runoff • Radiotag telemetry • No.4 - 57% Effective; Safe passage 96% • No. 3 – 77% Effective; Safe passage 96% • No. 2 – 44% Effective; Safe Passage 96% • Sluice Gate more effective than fishway • High flows affected study; impairing analysis of results between various operating scenarios
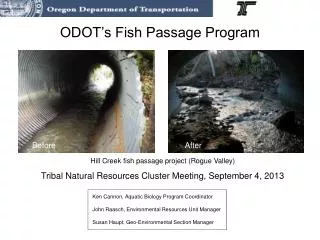
No. 3 Underwater Camera Assessment (2002) Time-lapse video recording, set to record at 5 frames/second Two Atlantic salmon smolts using the DRP No. 3 bypass during observed peak of the run. Notice smolts are using the bypass approximately mid-stream.
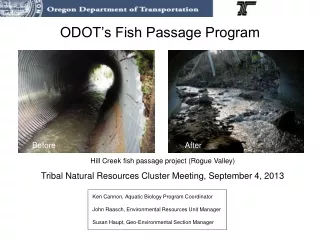
No. 3 Underwater Camera Assessment (2002) Marked hatchery smolt (left) and unmarked wild salmon (right) using the DRP No. 3 bypass during spring 2002.
Studies and Modifications (cont.) 2003 Modifications • No. 4 Trash boom redesigned and installed 1’ depth (vs. 5’ previously) • No. 4 operated to maintain 2’-3’ drop into collector • No. 3 Trash rack modified – bar spacing 1’ & 2’ • No. 2 Alternative passageway (sluice gate) studied 2003 Evaluations • Repeated Operational Scenarios/Radiotagging study • No. 4 Pit tag monitoring
Studies and Modifications (cont.) • 2003 – Repeated Operational Scenarios/Radiotagging study • No. 4 - PIT-tag monitoring
Studies and Modifications (cont.) 2003 Evaluations Results • Radiotag telemetry • No.4 - 57% Effective; Safe passage 93% • No. 3 – 73% Effective; Safe passage 90% • No. 2 – • Fishway 32% Effective; Safe Passage 90% • Sluice gate 81% Effective; Safe Passage 97% • Combined/overall – 60% Effective; Safe passage 81% • No. 4 Maintaining drop into collector restricted flow to about 60% of maximum capacity • No.2 Sluice Gate clearly more effective than fishway • Some high flow, but did not skew results
Studies and Modifications (cont.) 2003 Evaluations Results PIT Tag Monitoring • Limited number of fish found, shocked and tagged in previous Fall • May have been late • No Pit tagged fish hit monitor
Summary of Radiotagged Results • Passage preference for evening/ early morning hours • Site specific issues • Flow vectors and velocities toward intake significant • Racks spacing variable has not been significant • Flow ratios significant • Overall Safe passage should be equally considered as meeting passage objective • Operational changes can affect passage effectiveness; seasonal specificity and time of day can reduce the cost