Download
1 / 39
390 likes | 515 Vues
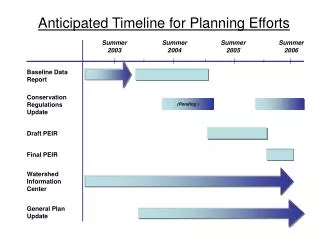
Join our summer professional development program designed for school principals, focusing on the "Getting Results!" framework for effective school improvement planning. Participants will learn to navigate the key differences in PSSA reporting categories, analyze data across multiple sources, and engage in discussions about root causes affecting student outcomes. We’ll cover the new SIP format, review improvement targets for student proficiency in reading and mathematics, and explore strategies for increasing student attendance and graduation rates for continuous improvement.

E N D
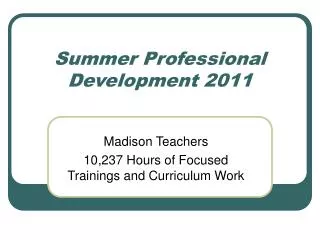
Getting Ready for School Improvement Planning Principal Professional Development Summer 2005 Office of Accountability, Assessment, & Intervention Office of School Intervention & Support
Goals Participants will gain skills for their use of the Getting Results! frameworks. Participants will: • become familiar with the differences and similarities between the 2004 and 2005 PSSA reporting categories • practice analyzing data and synthesizing findings from multiple sources using their own data • engage in discussion of “root causes”
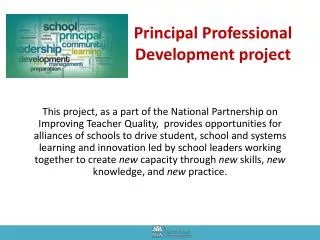
What is Getting Results! ? • framework for school improvement planning developed by PDE that the School District of Philadelphia has adapted
What’s Different?What are the Implications? • AYP - Grades 3 through 8 and 11 • Reported Results - Assessment Anchors • Parent Involvement Action Sequence • New SIP Format • PDE Review of SIPs • Science will be introduced in next year’s SIP
New PSSA Reading Reporting Categories
New PSSA Mathematics Reporting Categories
Summary of Shared Values Step 4: Development of People PD Calendar Milestones of Progress Executive Summary Prioritize Improvement Targets School District of Philadelphia School Improvement Planning Process Step 1: Summarize Data Identify Root Causes Step 5: Documentation Step 2: Design Step 3: Delivery Getting Results! A 5 Step Process
2005-2007 Student Achievement Improvement Targets * Every school improvement plan must address the following areas of student success: 1. READING At least 54% of all students will be proficientin Reading, as measured by the annual state-wide PSSA assessments. 2. MATHEMATICS At least 45% of all students will be proficientin Mathematics, as measured by the annual state-wide PSSA assessments. 3. STUDENT PARTICIPATION IN STATE ASSESSMENTS At least 95% of eligible students will participate in required state-wide assessments. 4. STUDENT ATTENDANCE Student attendance in school will improve continuously (to an average of at least 90% by 2014). 5. FOUR-YEAR GRADUATION RATE (high schools only) The 4-year graduation rate for high school students will increase consistently (to at least 80% by 2014). * If your school has already met these targets for all students and student groups, consider setting your own challenging, ‘stretch’ targets that will ensure continuous improvement of instructional practices and student achievement.
Task Monitoring Of Evidence Task Evaluating Task Task Getting Results Process Flow DATA SOURCES DOCUMENTATION TARGETS ACTION SEQUENCES Step 3 Step 2 Step 5 Student Performance Goals ------------- Strategies & Interventions Data Summary Step 1 Achievement School Profile Walk Through Step 4 SAT Team Professional Development Reporting Repeat Steps 1 through 5 for each component of the SIP.
Summarize the Shared Values • Summary includes the shared values, mission, core beliefs, and vision of the school community
Data Collect, Synthesize, Prioritize and Summarize • analyze student data • identify most significant weaknesses/gaps • prioritize weaknesses/gaps
Data Analysis Guide Worksheets to Assist in Analysis of Multiple Data Sources for School Improvement Planning
General Questions to Guide the Analysis of School Data • Think about the following questions/issues/trends as you analyze data. We will end this guide by revisiting these questions. • Separately consider the following for Reading and Mathematics: • What does the data tell you about your school’s performance on the PSSA in terms of: • Trends across time? • Performance with regard to progress: i.e., percentage of students scoring Advanced & Proficient and Basic & Below Basic? • Performance across grade levels, if your school has more than one tested grade (i.e.,this year grades 3, 5, 8, 11; next year grades 3 through 8 and 11)? • Performance of relevant student groups (i.e.,any gaps between groups or with respect to the annual target)? • Performance by PSSA Reporting Category and Assessment Anchors?
PSSA Data Analysis Section B - Instructional Priorities Section C - Open-Ended Task Data Section D - Other Reading Assessment Data
TerraNova / Supera Analysis Worksheet - Reading • Purpose: This document is designed to help you look at several years of TerraNova data by analyzing trends in preparation • for identifying target areas for your School Improvement Plan. (Please remember this is one of multiple sources of data that • you will use.) • The information needed to complete the following two charts can be found in the School Profile on the District’s • Website. • Reading
The information needed to complete this chart is located on the TerraNova Assessment Anchors Report for Reading (CRST 3).
Benchmark Test Data Analysis • Cumulative Benchmark Test Results – October 2004 – June 2005 • What do the data show about the school average percentage of items correct compared to the district average? For each Reading Standard, circle the grade level(s) where the average percentage of items correct was low( below 60%) and/or substantially lower( 5-10% point difference) that the average for the District: • Grade Level: • 3 4 5 6 7 8 9 10 1.1-Learning to Read Independently • 3 4 5 6 7 8 9 10 1.2-Read Critically in All Content Areas • 3 4 5 6 7 8 9 10 1.3-Reading, Analyzing and Interpreting Literature • 3 4 5 6 7 8 9 10 1.7 Characteristics and Functions of the English Language • 3 4 5 6 7 8 9 10 1.8 Research • Comments: • __________________________________________________________________________________________________________________________________________________________________________________________________________________
Data Analysis Activity Do you notice a difference across years? What about across grades? Are there discrepancies between Reading and Language? What are the instructional implications for your school? Turn to a partner and share your findings.
Root Causes Introduction & Exercises
Root Causes A Root Cause is the deepest underlying cause or causes of positive or negative symptoms within any process, which if removed, would result in elimination, or substantial reduction, of the symptom.
Why Root Cause Analysis ? Root Cause Analysis: • helps to eliminate the problem, not just the symptom • conserves scarce resources • promotes discussion and reflection • provides rationale for strategy selection
Determining Root Causes Will correcting or eliminating this root cause result in success? If yes, then it is a root cause. If no, then it is a contributing factor.
Possible Root Cause If teacher content knowledge improves greatly, then student achievement will increase. Is this necessarily true?
A Guide for Identifying Root Causes “We can talk or dream about the glorious schools of the future or we can create them .” Marilyn Ferguson
Dimensions of School Improvement SUPPORTING REALM parents governance personnel ENABLING REALM materials schedules professional development organizational structures CORE REALM instruction curriculum assessments school leadership monitoring staff accountability for performance others identified by the school funding student readiness to learn others identified by the school
Checking for Understanding What are your questions about analyzing data and identifying root causes?
Step 1: DataWhere are we now? • Summary – includes highlights of the analyses of student data • Identification of root causes that prevent or promote student achievement
Step 2: Design Where do we want to go next? • Select research based, high leverage strategies that address the root causes • Action sequence for reading and mathematics is required • Thematic schools may select a strategy to support their theme
Step 3: Delivery How are we going to get there? • Same process • Importance of building capacity of staff • Maximum use of resources (human and financial)
Step 4: Development of People What additional skills do we need? • Determine training and skills needed by staff • Professional development calendar aligns to address rootcauses/student needs
Step 5: Documentation How do we track our progress? • Effectiveness of strategies • Documentation process (time intervals)
Milestones of Progress • Quality of Teaching • Quality Leadership • Artful Use of Infrastructure • Continuous Learning Ethic
Checking for Understanding What are your questions about the action sequence?