Download
1 / 47
470 likes | 637 Vues
An Introduction to the Graphic Syllabus Katherine M. Sauer Metropolitan State College of Denver ksauer5@mscd.edu Economics Teaching Conference October 27 th – 28 th 2011 New Orleans, LA. How I became interested …. personal frustration

E N D
An Introduction to the Graphic Syllabus Katherine M. Sauer Metropolitan State College of Denver ksauer5@mscd.edu Economics Teaching Conference October 27th – 28th2011 New Orleans, LA
How I became interested … personal frustration constant emails asking questions for which the answers are clearly stated in the syllabus push for assessment link course objectives to learning activities to assessment critical examination of my syllabi
An Analysis of My Syllabus • basic course and instructor information • official course description (jargon) • Introduction to the principles of economics, with an emphasis on individual economic units. Topics • include … • course objectives (jargon) • demonstrate graphically the production possibility • frontier, market equilibrium dynamics, …
list of course prerequisites and expected skills • …how to do algebraic calculations, understand • graphs, and communicate clearly both verbally • and in written form • (what if they don’t have these skills?) • required course materials • This course utilizes an online product called • Aplia. Through Aplia, you will receive an • electronic copy of the text book and you will • complete your homework assignments online. • Instructions for purchasing and accessing Aplia • can be found on the last page of the syllabus. • (no mention of actual text or author)
components of course grade • In class assignments will vary in nature. They will • be worked on in groups during class time and will • not be announced in advance. If you are not • prepared for class or are not contributing to your • group, you will be asked to work alone. No make • ups are given. You are allowed to drop two in • class assignment grades. • - “procedural” descriptions • - imperative language
course and institutional policies • (this section gets longer every year …) • course schedule • - chapter titles, by week
My thoughts on my syllabus: - long - boring - authoritative - not very “me” - not reflective of my actual class I wouldn’t want to take my own class !! Is my syllabus the reason that my students don’t refer to my syllabus?
“[Syllabi] list the assigned readings but not reasons why the subject is worth studying or important or interesting or deep, or the learning strategies that will be used in the course.” “What such syllabi often omit is any mention of learning.” Singham, Mano (2007) Death to the Syllabus! Liberal Education. 93(4): 52-56
My Original Principles of Microeconomics Syllabus http://www.wordle.net/ (where is the learning?)
Learning Objectives for Today’s Presentation on the Graphic Syllabus define the term “graphic syllabus” transform existing syllabi into graphic syllabi identify examples of graphic syllabi explain rationale for using graphic syllabi apply graphic techniques to text
A graphic syllabus is… … a flowchart or diagram that displays the sequencing and organization of major course topics through the semester. Much like a concept map or mind map, it uses spatial arrangement … to show the logical, temporal progression of the course … In addition, it may – but need not – use icons, pictures, and visual metaphors to convey the meaning of words, concepts, and relationships. The Graphic Syllabus and the Outcomes Map: Communicating Your Course by Linda Nilson (Jossey-Bass, 2007) page 26
Fundamental Economic Principles Government Intervention in Markets weeks 5 - 6 -price controls (ch 6) -taxes on goods and services (ch 8) -international restrictions (ch9) How Markets Work weeks 2 - 4 -why we use markets (ch 3) -supply and Demand (ch 4 &5) -measuring economic well-being (ch 7) Markets Advanced Applications weeks 13 - 14 -labor market (ch 18) -consumer choice theory (ch 21 ) When Markets Fail week 7 -externalities (ch 10) -public Goods (ch 11) Markets & Competition weeks 9 - 12 -production, costs and profits (ch 13) -competitive markets (ch 14) -monopoly markets (ch 15) -other types of competition (ch 16,- 17) (my micro course)
http://www.cmu.edu/teaching/designteach/design/syllabus/samples-creative/ BayesianMethodsSyllabus.pdf
The Graphic Syllabus and the Outcomes Map: Communicating Your Course by Linda Nilson (Jossey-Bass, 2007) page 46
http://www46.homepage.villanova.edu/john.immerwahr/TP101/Prep/Graphic_ syls.pdf
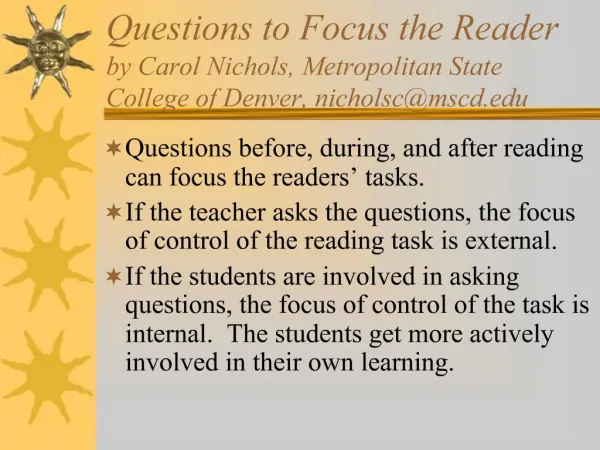
Why should I consider using a graphic syllabus in my course?
Syllabi serve several important purposes, the most basic of which is to communicate the instructor’s course design to students. • - goals • - organization • - policies • - expectations • - requirements Carnegie Mellon University website (accessed 10/15/2011) http://www.cmu.edu/teaching/designteach/design/syllabus/index.html
Other functions served by a syllabus include: - To convey our enthusiasm for the topic - To show how this course fits into the big picture - To set the tone for the course - To help students assess their readiness for the course by identifying prerequisite areas of knowledge - To help students manage their learning by identifying outside resources and/or providing advice Carnegie Mellon University website (accessed 10/15/2011) http://www.cmu.edu/teaching/designteach/design/syllabus/index.html
Learner-Centered Syllabus • - focus on the learning process • The Course Syllabus: A Learning-Centered Approach by JudethGrunertO’Brein, Barbara Millis, and Margaret Cohen (Jossey-Bass, 2008, 2nd edition) • Learner-Centered Teaching: Five Key Changes to Practice by Maryellen Weimer (Jossey-Bass, 2002) • Developing Learner-Centered Teaching: A Practical Guide for Faculty by Phyllis Blumberg (Jossey-Bass, 2008)
How can I best communicate my course to my learners? Who are my learners? - discipline novices - millennial generation How to reach discipline novices? - reduce jargon - give them a really good map How to reach millennials? - net generation (visual) graphic syllabus
Side Note: An Annotated Syllabus helps track your thinking about course design and teaching. • Why are your policies the way that they are? • Why are you asking what you are asking? • Why did you structure the course in the way you did? • How did a learning activity go? • Metro State’s Center for Faculty Development: • http://metrofacultydevelopment.pbworks.com/w/page/33934299/Home%20Page%20for%20Annotated%20Syllabi
Text vs Visual Information This: There are several learning objectives for today’s presentation on the Graphic Syllabus. At the end of the session, the successful participant will be able to transform an existing syllabus into a graphic syllabus. To this end, the presentation will include the definition of the term “graphic syllabus”, several examples of graphic syllabi, rationale for using a graphic syllabus, and an overview of techniques for turning a text syllabus into a graphic syllabus. or this:
More Reasons • dual-coding material into memory • The mind has two memories: • semantic = verbal • episodic = visual-spatial • Graphics allow concepts to be stored in both memories. • graphics convey information more efficiently than text • individual elements • relationship between elements Nilson’s The Graphic Syllabus pages 19-20
More Reasons • use as a reference throughout the course • - I use it to remind students where we’ve been, • where we are, and where we are going • helped me link my topics to learning objectives … ultimately to assessment • the content is now “front and center” in my syllabus • - before it was hidden in jargon-y descriptions and • a linear course topic list
Look at your course topics … • How the Topics Looked on My Syllabus • Intro to economics / models • Specialization and trade • Supply and demand • Elasticity • Efficiency of markets • Price Controls • Taxes • Tariffs • Externalities • Public Goods • Production • Perfect Competition • Monopoly • Monopolistic Competition • Oligopoly • Factor Markets • Consumer Choice How the Topics Look in My Mind
Ways to Organize Information A government may intervene in the economy in a variety of ways: price mechanisms, regulation, financing the provision of goods or services, or directly producing goods or services. price mechanisms regulation government intervention finance provision of goods direct provision of goods
government intervention price mechanisms regulations finance provision of goods direct provision of goods
direct provision of goods finance provision of goods price mechanisms regulations government intervention
government intervention price regulations finance direct mechanisms provision provision
price mechanisms regulations government intervention finance provision of good direct provision of good
Fundamental Economic Principles Government Intervention in Markets weeks 5 - 6 -price controls (ch 6) -taxes on goods and services (ch 8) -international restrictions (ch9) How Markets Work weeks 2 - 4 -why we use markets (ch 3) -supply and Demand (ch 4 &5) -measuring economic well-being (ch 7) Markets Advanced Applications weeks 13 - 14 -labor market (ch 18) -consumer choice theory (ch 21 ) When Markets Fail week 7 -externalities (ch 10) -public Goods (ch 11) Markets & Competition weeks 9 - 12 -production, costs and profits (ch 13) -competitive markets (ch 14) -monopoly markets (ch 15) -other types of competition (ch 16,- 17) (my micro course)
Types of Structures • competition and complementarity • - economic schools of thought • - different theories for same concept • parallelism • - theory & empirical results • - concept & underlying mathematics • process • - about a process • - teach how to do a process Nilson’s The Graphic Syllabus chapter 3
sequence / chronology • - based on logic • - based on time • categorical hierarchy Nilson’s The Graphic Syllabus chapter 3
Consider adding visual interest to other parts of your syllabus.
Consider adding learning objectives to your graphic syllabus. How Markets Work weeks 2 - 4 -why we use markets (ch 3) -supply and Demand (ch 4 &5) -measuring economic well-being (ch 7) Learning Objective: Apply microeconomic analysis to evaluate economic events and/or problems.
Public Finance
Let’s try it! • Keep in mind: • There is not one “right way” to do this. • - different types of road maps: scenic • route, fastest route, specific sites, … • You already have a framework in your head for • how the concepts fit together. • - might identify “tacked on” subjects • Play around with variations. • - iterative process • - perfect is the enemy of the good
Topic List for Principles of Macroeconomics Ten Principles of Economics Thinking Like an Economist Interdependence and the Gains from Trade Market Forces of Supply and Demand Measuring a Nation's Income Measuring the Cost of Living Production and Growth Saving, Investment, Financial System The Basic Tools of Finance Unemployment and Its Natural Rate The Monetary System Money Growth and Inflation Open-Economy Macroeconomics Theory of the Open Economy Aggregate Demand and Aggregate Supply Monetary and Fiscal Policy Tradeoff between Inflation and Debates over Macroeconomic Unemployment Policy Mankiw’s Brief Principles of Macroeconomics
The Macroeconomic Building Blocks GDP inflation unemployment How markets work Long Run Economic Growth - productivity - market for funds The Monetary System - money and banking - the Federal Reserve - the money market The Open Economy - international trade - market for foreign exchange A Model of the Economy as a Whole - GDP, inflation, and unemployment - government policy
Questions? Comments? How to reach me: @yogiconomist Katie (Sauer) Hart ksauer5@mscd.edu 303-556-3037