Download
1 / 40
400 likes | 568 Vues
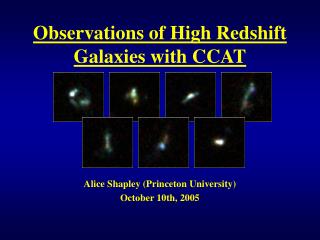
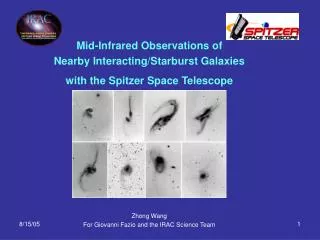
CCAT Studies of Nearby Galaxies. Gordon Stacey Cornell University. CCAT: The Nearby Universe. Starforming galaxies Continuum studies Spectral line studies Examples Active galactic nuclei: revealing the torus. Motivation. Extinction – we need to be able to observe the sources

E N D
CCAT Studies of Nearby Galaxies Gordon Stacey Cornell University
CCAT: The Nearby Universe • Starforming galaxies • Continuum studies • Spectral line studies • Examples • Active galactic nuclei: revealing the torus
Motivation • Extinction – we need to be able to observe the sources • Stars form in the dusty cores of molecular clouds so that probes of starformation are limited to the longer wavelength bands • Galactic nuclei are often extincted by many magnitudes of dust, e.g. the Galactic Center suffers 28 magnitudes! • Cooling power – clouds must cool to collapse and form stars • The light from young stars is absorbed locally by dust, and reradiated in the far-IR and submm bands • The Milky Way releases about half of its light in these bands • Starbursters and ULIGs emit most (up to 99%) of their light there
Motivation • Cooling power – clouds must cool to collapse and form stars • The primary cooling lines for the neutral ISM lie in the far-IR and submillimeter bands • Probes of the ISM – what is the effect of energy sources on the ISM… • Submillimeter lines trace the physical conditions (T,n,N…) of the gas, is it cooling to form stars, or being dissipated by starlight? • What are the effects of the interstellar radiation field on the ISM? • What are the effects of bars, spiral arm potentials and cloud-cloud collisions on the ISM?
The Extragalactic Niche • Low surface brightness in the short submm (200, 230, 350, and 450 um) windows: • It can be shown that the Atacama 25 m telescope is competitive per beam with any other terrestrial telescope existing or planned at these wavelengths • This is especially true for continuum work -- • Extragalactic work requires modest resolving powers: R = / ~ 1000 to 10,000, or v ~ 300 to 30 km s-1 • This can be achieved with direct detection spectrometers significant sensitivity advantages possible • Nearby galaxies are extended multiple beam systems are desirable • At present, large format spectrometers are easier to implement with direct detection systems.
Continuum Observations of Galaxies • The far-IR continuum emission from galaxies traces the deposition of optical starlight from nearby OB stars, or the diffuse ISRF • Traces regions of star formation in an extinction free manner. • Dust that peaks at 200 um is quite cold T ~ 20 K – trace the luminosity and mass of cold dust • For warmer dust, the submm colors are insensitive to T, since we are typically in the Rayleigh-Jeans tail. • However the warm dust properties are constrained by examining the apparent emissivity law. • Temperature and emissivity law yield dust column (mass) • Combined with shorter wavelength observations, we get the far-IR luminosity of the galaxy e.g. 38 or 60 um SOFIA or 70 um Spitzer observations, for which beam = 3.8”, 6”, and 20” respectively.
Visible IRAS ISO 175 m Continuum Observations • The far-IR and visible morphologies of galaxies may often be quite different • IRAS and ISO imaging of the (optically) Sb galaxy M31 reveal a ring of cool dust – no spiral pattern is visible • There is also warm dust (star formation) in the nucleus M31: Haas et al. 1998
Continuum Observations of M31 • Most of the dust has a temperature of only 16 K – much cooler than inferred from IRAS data • The warm dust/cool dust ratio varies little across the galaxy evidence for distinct dust populations • Cold dust mass ~ 3 107 M ten times greater than that inferred from IRAS data alone! • New dust mass, even if distributed uniformly would make the disk of M31 moderately opaque in the visible (AV ~ 0.5)
NGC 891 • Imaged at 450 and 850 um with SCUBA on JCMT (Alton et al. (1998, Israel et al. 1998) • Traces cold (T~ 17 K) dust in the disk • There appears to be emission at large scale heights in both images, but this is likely the exponential tail of the galactic plane • At the resolution of the JCMT images, less than 5% of the dust lies out of the main extinction lane • At the higher resolution and sensitivity possible with CCAT, it is likely we will that superbubbles and chimneys will appear tracing the expulsion of dust from the disk.
Charmandaris, Stacey and Gull 2002) Far-IR Continuum: Revealing the Starburst • For IR luminous galaxies, the submm continuum (esp. together with far-IR continuum) traces the far-IR luminosity in an extinction free manner so it reveals the locations and luminosity of the starburst • For example, in the Arp 299 interacting system, components “B” (NCG 3690 nucleus) and “C” (overlap) appear equally important with “A” (IC 694 nucleus) at even mid-IR wavelengths. • However, at 38 um the continuum traces reveals that most (~ 75%) of the emission arises in the nucleus of IC 694!
The Antennae Galaxy Submm: SHARC-2 NOAO: M. Rushing Spitzer IRAC Image
Time to Image Galaxies • The Antenna can be imaged very rapidly • In the 350 um continuum, the extended emission has a flux density of 0.2 Jy per 10” beam, or 20 mJy per 3.5” beam • In 200 seconds, CCAT attains a flux limit of 1 mJy/beam, or SNR ~ 20 • The flux is ~10 times smaller (per beam) at 850 um, but the beam is 850 ~ 6 350 and, with > twice the sensitivity at 850 um, we obtain SNR ~ 30 in 200 seconds • Even at 200 um: SNR ~ 10 in 1.6 hours of integration time. Image the Antennae in 4 bands (200, 350, 450, 850 um) in less than 2 hours, or only 10 minutes without the 200 um band! • For the less intense M83 system, a typical flux per beam is ~ 4 mJy @ 350 um, so that it takes ~ 1.3 hours to reach SNR > 20 over the 5’ FOV of the short submm camera. Image M83 in 43 bands (350, 450, 850 um) in 4 hours. • Would survey the brightest 100 nearby galaxies including quiescent spirals and starbursters
Spectral Lines: the COBE FIRAS Spectrum of the Galaxy • [CII] line is strongest cooling line from Galaxy (L ~ 6 107 L) • Cools molecular cloud surfaces,atomic clouds, and HII regions • [NII] ~ 1/6 and 1/10 as bright as [CII] • Important coolants for low density ionized gas • Line ratio ionized gas density. • [NII] 3P1-3P0 (205 m) line has same density dependence as [CII] for ionized gas constrains fraction of [CII] from ionized gas • For density bounded HII regions, the [NII] lines probe the ionizing photon rates: NLyman continuum Wright et al. 1991
Galactic Center Galaxy CO Rotational Diagram Neutral lines from the Galaxy • CO rotational transitions up to J = 8-7 detected • Strength of mid-J lines indicates substantial amounts of warm (T> 40 K), dense gas • Gas is particularly high excitation in the inner regions of the Galaxy It is clear that the CO cooling power on a galactic scale arises in the submm bands • The 609 and 370 m [CI] lines are ubiquitous • Line ratio is near unity, temperature sensitive • Tgas ~ 40 K The combined cooling in the 370 and 610 m lines equals the total cooling in all of the CO lines Submm Band 4-3 6-5 7-6
Unique Spectral Lines Available to CCAT • Critical Densities, Energy above ground ensure: • Important astrophysical probes of ionized gas, molecular clouds, photodissociation regions, shocked regions, and astro-chemistry • Important cooling lines for much of the ISM
Molecular Lines in the Submm Telluric Windows • The CO molecule is often the dominant molecular gas coolant • The run of CO intensity (including isotopic lines) with J constrains T, n, and mass It is the molecular gas reservoir that constrains future episodes of starformation • Low-J 12CO and isotopic CO lines cool the cold cores of molecular clouds and trace molecular cloud mass • Mid-J CO line emission signals the presence of PDRs associated with newly formed OB stars • High J CO line emission molecular shocks, e.g. the warm molecular outflows associated with OB starformation, or cloud-cloud shocks formed in spiral density waves
CO(7-6)/[CI] 370 m line intensity ratio vs. density for various values for the strength of the ISRF, G (Kaufman et al. 1999) The [CI] and CO(7-6) Lines • [CI] line ratio gives Tgas • Run of CO line intensity with J constrains molecular gas pressure • The CO(76) and [CI] 3P2-3P1 (370 m) lines are only 1000 km s-1 (2.7 GHz) apart – easily contained in one extragalactic spectrum • Excellent relative calibration • “Perfect” spatial registration This line ratio of particular interest, as it is very density sensitive
Submm Line Observations: The [CI] and mid-J CO Lines • The CO(65) line first reported from a few starburst nuclei (Harris et al. 1991) • Gas is both warm, and dense – modeling was fit into a PDR (stellar UV heating) scenario • Several galaxies detected & mapped in the [CI] (610 um) line: • The [CI] line intensity traces Co column (high T, high n limit) • The [CI] line is an excellent tracer of molecular clouds in galaxies, perhaps better than CO (Gerin and Phillips, 1999) • The combined cooling in the [CI] lines is comparable to the CO line cooling – most (85%) of this is in the 370 um line. • There is a very high Co/CO abundance ratio (~ 0.5) in starburst galaxies – much higher than Milky Way values. This is due to: • Fractionally more photodissociated gas due to cloud fragmentation • Production of Co in molecular cloud interiors due to processes associated with high cosmic ray fluxes or non-equilibrium chemistry
Starburst Galaxies: Mid-J CO • SPIFI CO(76) mapping of NGC 253 shows emission region extends > 500 pc • Most of 2-5 107 M nuclear molecular gas is in a single highly excited component: n(H2)~ 4.5 104 cm-3, T = 120 K • Consistent with CO and 13CO and H2 rotational line emission • This warm molecular gas is 10 to 30 times PDR gas mass (traced by [CII] & [OI] lines) • PDR scenarios fail to account for heating of this much molecular gas CO is heated by cosmic rays (~ 800 MW value) from the nuclear starburst. • Also provides a natural mechanism for heating the entire volume of gas Bradford et al. 2003, ApJ 586, 891
SPIFI-JCMT [CI] 371 um & CO(76) (372 um) spectrum of the NGC 253 nucleus TMB = 1 K CO(76) [CI] Starburst Galaxies: Mid-J CO and [CI] 370 um Lines [CI] and CO(76) lines simultaneously mapped from NGC 253: • The [CI]/CO(76) ~ 2/3 n > 3 104 cm-3– consistent with our CO model • The [CI] (370 um)/(610 um) line ratio (~ 2) is sensitive to gas temperature, and yields Tgas>100 K – consistent with our CO model • From distribution and physical conditions, C0 and CO well mixed Cosmic ray enhancement of C0 abundance (cf. Farquhar, et al. 1994) • Consistent with our CO model the primary heating source is cosmic rays from SN in starburst Added heat at cloud cores will inhibit cloud collapse – halting starburst Nikola et al. 2005
CO(7-6) and [CI] from the Antennae Galaxy Interaction Zone 21” region TMB = 100 mK [CI] CO(7-6) [CI] CO(7-6) 30” region TMB = 200 mK [CI] CO(7-6) TMB = 50 mK • [CI] line is constant andubiquitous, it cools the overall ISM • CO(7 6) is greatly enhanced at the starburst interaction zone reflecting the high gas excitation there • Strong mid-J CO emission reflects influence of OB stars Isaak et al. 2005
Bars, Spiral Arms, and Starformation: M83 ISO: [NII] 122 m ISO: [CII] 158 m ISO: [OIII] 88 m ISO mapping shows how the far-IR lines trace starformation with 70” beam • Spiral arms/inter-arm contrast highest for [OIII] 88 m line earliest type stars (star formation) reside in the spiral arms • At bar/spiral arm interfaces, [OI], [CII], & [OIII] strongly enhanced greatly enhanced starformation activity ~ Orion interface region 0.2 pc from 1C! Expect strong mid-J CO line emission there. • The SW bar region strong in H and CO as well (e.g. Kenney & Lord, 1991) Orbit crowding likely triggers a massive burst of starformation
3” [CI] beam 70 pc Bars, Spiral Arms, and Starformation: M83 Can easily resolve the far-IR continuum, ionized gas ([NII]), atomic/molecular gas [CI] and dense molecular gas (mid-J CO) as they cross the spiral arms – can we trace the compression and “ignition” of the next generation of stars? ISO: [OIII] 88 m 6” Resolution CO (1-0) Map on false-color HI (Rand Lord, & Higdon 1999) KAO Map in [CII] 55” Beam (Geis et al.)
TMB vLSR Oberst et al. 2005 Position of Carina 2 3 4 5 6 7 8 [NII] is Detectable from the Ground • We mapped the [NII] distribution from Carina nebula using SPIFI at the South Pole in 2.9% zenith transmission! • Good days at South Pole or for CCAT might expect ~ 20% transmission
Time to Map M83 • Suppose we map M83 in the [CI] 370 m line: • Beam size ~ 3.7”, or 90 pc at 5 Mpc • Map eastern spiral arm: 2’ 3’ region • Requires 800 pointings for sparse (single beam) sampled map • Predicted line flux is ~ 1 10-17 W-m2 in 3.7” beam • 16 seconds of integration time yields SNR ~ 20 • Total time for project: 7 hours including a factor of 2 for overheads with a single pixel receiver! • Entire galaxy (35 square arcmin) takes 40 hours A long slit spectrometer would reduce this time by the number of beams along the slit (probably ~ 32) so that the whole project will take only about an hour • With modest array format along dispersion direction (12 to 16 pixels) would have a map in CO(76) as well.
2” beam 100 pc Edge on Galaxies: NGC 891 • Easy to image nearby edge-on galaxies in the lines and continuum tracers: Scale height of ISM – energetics -- super bubbles, chimneys • [NII] as extinction free, low excitation probe of ionized gas • [CI] traces atomic and/or molecular ISM • Regions of high mass star formation should appear in the mid-J CO lines • Far-IR continuum, star formation and cold dust • Scoville et al find CO(1-0) scale height ~ 200-300 pc (4 to 6”) so that the galactic plane will be resolved.
CCAT and Active Galactic Nuclei • Galaxies for which a much of their luminosity is not derived from stars are termed “active galaxies” • First recognized active galactic nuclei (AGN) were Seyfert Galaxies (Carl Seyfert, 1940s) • Extremely bright, point-like nuclei • Strong and broad emission lines -- non-stellar • Highly ionized species • Types of AGN: Seyfert and Markarian galaxies, radio galaxies, quasars, LINERS, Bl Lac objects, OVVs, blazars, broad-line radio galaxies... • Feels a bit like botany -- but, their exists a single “Unified Model” for what makes an AGN.
Unification Scheme for Active Galaxies • Energy is derived from accretion onto super massive black holes • There is an accretion disk, likely fed by a circumnuclear torus, or the tidal disruption of stars in a nuclear cluster • The jets often seen emanating from the nuclei of active galaxies are confined by a pc scale molecular torus • Broad lines come from gas (up to 1000 M) photoionized by very hot accretion disk within 1 pc of the super-massive black hole • Narrow lines come from gas (up to 109 M) in regions 10 to 1000 pc from the nucleus.
outflowing jets infalling stellar and gaseous material narrow line region dusty molecular torus broad line region accretion disk AGNs: Unified Model
Tests of the Unified Models • The Model: Difference between Seyfert 1 and Seyfert 2 galaxies is a geometric selection effect • Seyfert 1 are viewed face-on so that the broad line region is visible • Seyfert 2 are viewed edge-on so that the broad line region is obscured by the torus. Artist’s conception of the doughnut shaped torus that confines the emission from an active nucleus (Credit ESA).
Detecting the Confining Torus • The confining torus should be both very warm (1000 K), and very dense (~ 107 cm-3): easily detected in the far-IR dust and line emission (CO, [OI], H2O; Krolik & Lepp,1989) • For example, the CO rotational line emission is predicted to peak near J ~ 58, or 48 m: • L58-57~ 7 1040 fabsLX44 ergs-s-1 & L17-16 ~ 2 1039 fabsLX44 ergs-s-1* • Typical source at 100 Mpc has a line flux of ~ 6 10-18 W-m-2 • High J CO lines are clear signatures of the confining torus – and are very sensitive to the physical conditions of the torus • The high J CO lines are the primary coolant for the torus – for a warm, optically thick cloud, the luminosity is proportional to J3. • Why hasn’t this been detected? Predictions are significantly below the detection limits of ISO/LWS at 48 m and 153 m – however, CCAT could detect such a source in the CO(1312) line at 200 um withSNR ~ 100 in 20 minutes *fabs is the fraction of hard x-ray emission absorbed by the torus (~10%), and LX44 is the ionizing luminosity in units of 1044 ergs –s-1 (Krolik & Lepp,1989)
Why use CCAT? • Low and mid-J line emission may be difficult to detect due to intervening molecular ISM heated by starburst • A key to detection is spatial resolution: to pull the CO emission out of the foreground gas, and the wavelength coverage needed address CO lines only excited in the torus • CCAT has advantages over other platforms • CCAT’s spatial resolution is as better than contemporaneous platforms (e.g. SOFIA or Hershel) in the far-IR • The far-IR CO lines are by far the most sensitive to the physical conditions of the torus, so that CCAT adds unique and important information even if ALMA can spatially resolve the source in the submillimeter CO lines
CCAT beam at 200 m Line flux prediction ~ 5 105 L, or 7 10-17 W/m2! – easily detectable SNR 100 in 20 minutes.
CCAT and Nearby Galaxies • Spatial resolution: • 2.0” – 8.5” from 200 – 850 m • 24 -- 100 pc @ 2.5 Mpc (NGC 253) • 50 -- 200 pc @ 5 Mpc (M83) • 200 – 800 pc @ 20 Mpc (NGC 1068) • Can, or nearly can: • Resolve individual GMCs in nearby galaxies • Resolve arm/interarm/bar interfaces in nearby galaxies • Distinguish the accretion disk from the torus for very close galaxies, e.g. the Galactic Center • Distinguish the torus compared with parent galaxy for nearby active galaxies • Sensitivity: • 10 to 40 times greater than prior platforms, and comparable to ALMA per beam for point sources especially in the continuum • Sufficient to map a hundred nearby galaxies in the continuum and several lines in a few hundred hours • Sufficient to undertake a survey of nearby AGN for high J torus emission
The [CII]/far-IR continuum ratio as a function of G (from Kaufmann et al) Redshifted [CII] • The [CII]/far-IR continuum is a sensitive indicator of the strength of the ambient ISRF, G The [CII] line detection yields the concentration of the starburst • In regions with the highest UV fields (young starbursts, AGNs), the [CII]/far-IR continuum ratio is depressed • Reduced efficiency of photoelectric effect • Increased cooling in [OI] 63 m line • More diffuse fields (like M82) results in larger [CII]/far-IR ratio Detecting [CII] from highly redshifted galaxies probes star formation in the epoch of galaxy formation
Grating BP Filter Wheel M4 ZEUS Spectral Coverage LP Filter 2 Detector Array M6 M2 M3 4He Cold Finger LP Filter 1 Spectral coverage of ZEUS, superposed on the Mauna Kea windows. Entrance Beam f/12 M5: Primary M1 Scatter Filter Dual stage 3He refrigerator 4He cryostat The Redshift (z) and Early Universe Spectrometer (ZEUS) • A device as simple as an echelle grating spectrometer can detect this line as the orders of the echelle match the telluric windows
Estimates of the comoving star formation history (Blain et al). Filled squares and circles toward the bottom represent the original Madau plot based on optical/UV HDF observations (Madau et al). Open squares correct this data for dust extinction (Pettini et al). The 7 upper curves are models that are consistent with the SCUBA data. The solid lines beneath the curves mark the redshft ranges accessible to ZEUS. ZEUS Windows Far-IR Lines and the Early Universe • One can detect the [CII] line and several other far-IR lines in the redshift intervals from 1 to > 5 • [CII] PDRs, low density HII regions, atomic clouds • [OI] PDRs • [NII] low density HII regions • [OIII] HII regions, O stars • Covers just the region of redshift space where the most evolution per co-moving volume occurs, and also where the UV/optical techniques are most affected by extinction
Far-IR Lines from High-Z Galaxies Detectable with CCAT • The calculated sensitivities are 5 in 10,000 secs on CCAT • Our continuum surveys will uncover many tens of thousands of distant galaxies observable in their [CII] line radiation with direct detection spectrometers
ULIGS Milky Way Redshifted [CII] Emission Yields Far-UV Field Strength and Redshifts • The [CII] line is detectable at redshifts in excess of 5 for Lfar-IR > 3 1011 L • ULIGS have L > 1012 L,, and [CII]/far-IR > 0.03% -- [CII] still readily detectable! • It is the lower luminosity systems that are most interesting with respect to galaxy assembly – these will likely have relatively bright [CII] line emission • [CII] line is uniquely bright, but redshifts can be verified (again with a gain to the physical understanding) by observing the other bright far-IR lines.