Download
1 / 26
260 likes | 388 Vues
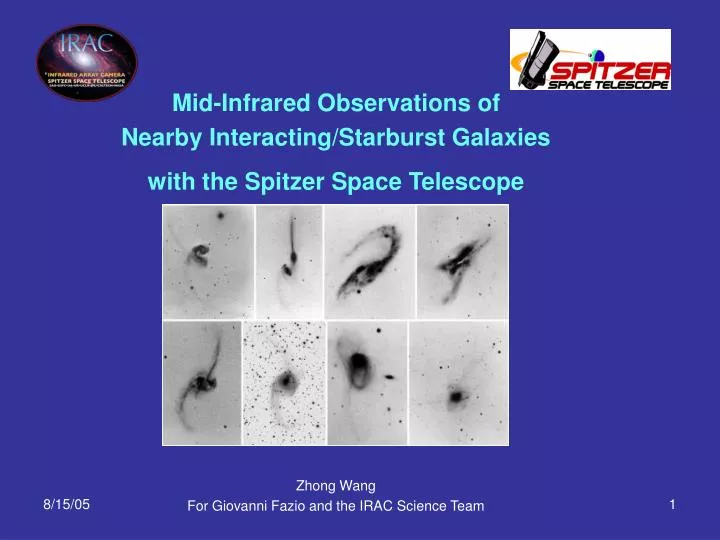
Mid-Infrared Observations of Nearby Interacting/Starburst Galaxies with the Spitzer Space Telescope Zhong Wang For Giovanni Fazio and the IRAC Science Team. Science Goals:

E N D
Mid-Infrared Observations of Nearby Interacting/Starburst Galaxies with the Spitzer Space Telescope Zhong Wang For Giovanni Fazio and the IRAC Science Team
Science Goals: • Trace locations of active star formation, often with heavy extinction from dust. Explore possible connections to more distant ULIRGs. • Measure spectral energy distribution (SED) of the star forming regions, identify energy source. • Compare with kinematics, spectroscopic probes, and other types of star formation tracers to determine the role of interaction in starburst and evolutionary history of these systems
Why interacting systems? • Most of the infrared luminous galaxies are found to be interacting systems • This is even more true for the ultra-luminous infrared galaxies (ULIRGs) • Characteristics of Our Sample: • Using IRAC/MIPS to observe ~30 infrared luminous, interacting systems • All galaxies have significant amount of gas/dust, and active star formation • Systems are mostly recent interactions, at various stages of final merging • Many have high-quality imaging data in UV/optical, NIR, radio and X-ray Ishida et al (2005)
GTO Program onInteracting/StarburstGalaxies Observations of ULIRGs in the Sample: (see presentation by Jason Surace)
Nearby interacting/starburst systems: NGC 4038/9 (the Antennae) NGC 6240 NGC 6090 NGC 1068 NGC 3690 NGC 520 NGC 7252 NGC 2623 Arp 220
A Primary Example: the “Antennae” A Proto-typical interacting pair/merger
The ISM component Hibbard et al (2001) have mapped HI gas in the two extended tidal tails as well as in the central region. CO and other molecular line observations with IR, mm/submm telescopes detect denser gas in the center e.g., Standford et al (1990), Wilson et al (2000), Gao et al (2001), Zhu et al (2003), Hass etal (2005), Iono etal (2005). Optical andRadio 21-cm CO contours
The dust lanes H Overlap region Dust emission is also measured with SCUBA (Hass et al 2000) B, V
Hubble and ISO findings Whitmore et al (1995, 1999) and Zhang et al (2001) found based on HST B, V and H images that the Antennae contains numerous (1,000+) young stellar clusters or super-clusters, perhaps as a result of the interaction. The ages of these clusters range from one to a few hundred million years. Mid- and far-infrared images from KAO and ISO (7 to 160m) show that the center of NGC 4038 and the overlap region are the major contributors of the infrared flux (Vigroux et al 1996; Kunze et al 1996; Bushouse et al 1998; Mirabel et al 1998; Xu et al 2000). ISO WFPCII data Of individual Young stellar Clusters (Whitmore et al 1999) 15 m peak
Galaxy SEDs in the mid-IR • Potential Contributors: • Stellar continuum (B-B) • Small dust grains • Large dust grains • PAHs • Possible AGN component (power-law)
Galaxy SEDs in the mid-IR Empirical modeling: Dale et al (2001, 2002) have shown that the warm dust emission from galaxies can be parameterized as a function of heating intensity of UV photons. The spectral region that is most sensitive to the level of star forming activities is between 20 and 42 m Dale et al. (2001)
Antennae in IRAC bands At longer IRAC wavelengths, warm dust emission becomes increasingly more important 3.6 µm R 8.0 µm IRAC
The stellar mass component Ks (Martini 2005) IRAC 3.6m
The warm dust emission IRAC 4.5m IRAC 8.0m Wang et al. (2004)
The photon-heated dust grains --- recent star formation sites MIPS 70m MIPS 24m
Star formation indicator The MIPS [24-70] map of the Antennae provides a quantitative indicator of star formation sites as well as star formation intensities in various parts of the system, especially in the overlap region, where the starburst activities approach the level of those in the ULIRGs. MIPS [24 -70] map Wang et al (2005) Dale et al (2000)
How to measure the mid-IR fluxes This would be a typical approach (e.g., SINGS). But it would not be appropriate for interacting/irregulars such as the Antennae
How to measure the mid-IR fluxes Using analysis tool HIIPhot to measure fluxes, based on high-resolution H image (with B. Penprase) In effect, we divide emission areas into large “HII” regions, based on their morphology 2 3 1 1 4
Unusually strong 4.5 m flux Why is the [4.5-3.6] color very different in active star forming regions? Maybe we’re seeing a large amount of shocked molecular gas as those found in certain outflow regions in the Milky Way. ? 3.64.58.0 Reflection nebular: NGC 7129 (Megeath et al 2004) R 4.5 H
Nine-panel comparison V Ks H 24 3.6 8.0 70 450 850
Details of nine-panel image H Ks 3.6 24 8.0 70 450 850
SEDs in the mid-IR Instead of measuring fluxes over the entire galaxies, we can now trace the SEDs ofindividual regionsIn the interacting pair, tracing the progression of the merging effects. From SINGS
WF2 Hα Lípari et al ‘04 “Off-nuclear” Star formation sites B, I NGC 3256 “Secondary Nucleus” WFPC2 IRAC 3.6,4.5,8.0 µm Zepf et al ‘99
NGC 3690 3.6 8.0 70 1.6 24
Summary With the higher angular resolution and sensitivity of spitzer imaging observations, individual regions of nearby interacting/starburst galaxies can be studied in greater detail in terms of gas/dust contents, SEDs, star forming rate/efficiency, and the effect of shocks. IRAC/MIPS data can be better analyzed with the help of short wavelength data (e.g. HST). In the Antennae and NGC 3690, the most intensive starburst activities, appear to have been triggered well before the final merging of the two main gas disks and well outside the gravitational center of the system, but with efficiencies comparable to those of ULIRGs. The spatial distributions of atomic gas, molecular gas, warm dust and ionizing photons are indicative of a progressive change from denser gas concentrations to forming stars in clusters. Thre observed active supernova explosions are apparently related to this. In the most active regions we also find particularly strong emission at 4.5m, suggesting an possible origin from shocked molecular gas. This, along with the variation of MIPS [24-70] ratio suggest that the most active star formation can be a very localized phenomena in early-stage mergers. Combined with observations from other wavelengths, a more complete picture of galaxy-galaxy merger and associated star formation process is emerging and ready to be compared with a new generation of theoretical models.