Objectives and analysis
Objectives and analysis. Module B2, Session 14. Learning Objectives. students should be able to Explain some criteria for modifying initial objectives, once the data are available Explain the importance of specifying objectives precisely before starting an analysis

Objectives and analysis
E N D
Presentation Transcript
Objectives and analysis Module B2, Session 14
Learning Objectives students should be able to • Explain some criteria • for modifying initial objectives, once the data are available • Explain the importance of specifying • objectives precisely before starting an analysis • Be able to outline a simple table or graph • that corresponds to a stated objective • Be able to complete a simple table or graph • given an objective and an outline. • Review a table or graph to specify • to what objective(s) this presentation corresponds
Contents • Introduction of the ideas • Sitting in on a review class • (Flash presentation) • Practical work • Using rice survey and the Tanzania survey • Discussion
Defining the objectives of the study • In defining statistics (Session 3) • Statistics is NOT just collecting numbers • It is collecting numbers with a purpose • So, as part of the planning for a study • You must specify the objectives • You need this also, before getting a budget! • Once you have your overall objectives • You plan the study • Collect the data • And get the data ready for analysis
Analysis objectives • Before you start the analysis • You review the overall objectives • Possibly modify them for the analysis • Why? • Perhaps some objectives are not possible • Questions may have been misunderstood • Questions answered in an inappropriate manner • etc • Perhaps new objectives become possible • A practical complication adds a new objective • A minor point becomes more crucial
Overall objectives – small example • Rice survey • Two objectives • Estimate total rice production • in the district • Investigate the possible relationships • between production and cultural practices • and justify the questions in the study
Objectives and measurements • The objectives led to the questions • the measurements we took • 1st objective – total yield in the district • So we measured the yield on sampled plots • 2nd objective – relationships with cultural practice • so we asked about size of field, fertilizer, variety • See how the objectives • lead directly to the questions
Objectives of the analysis • Now the data are ready for analysis • Can we still meet the objectives? • Possibly – so continue with both parts to the analysis • But suppose we now realised • that date of planting was crucial, and not measured • or there was disease on some fields, not recorded • Perhaps the 2nd objective is not attainable • So look carefully at the objectives • And be prepared to rewrite them • Or state them more precisely
Breaking the “curse of variation”! • Statistics is concerned with studies where variation is important • Otherwise you only need a sample of size 1! • This was discussed in the Concepts Session - Session 3 • Hence also take measurements • if they may help to explain variation in the data • even if that measurement is not related to a specific objective • Understanding variation in key variables • like the yield in this rice survey • Is effectively an objective itself in all statistical studies • Then the analysis can adjust for these aspects
Objectives once you see the data • Sometimes looking at the variables • permits you to specify objectives • That’s not as good as starting with them • But it is still useful • And the tables and graphs • Should then follow directly • From the objectives of the analysis • This is illustrated in the demonstration • Look for the following 2 slides in particular
Practical work • Do practical 1 • It benefits from discussion • So it is good for students to work in pairs • First is an demonstration lesson • This should partly be revision • Complete the sections in the practical sheet as watch the lesson • Then the rice survey data are analysed • Finally data from the Tanzania agriculture survey are processed
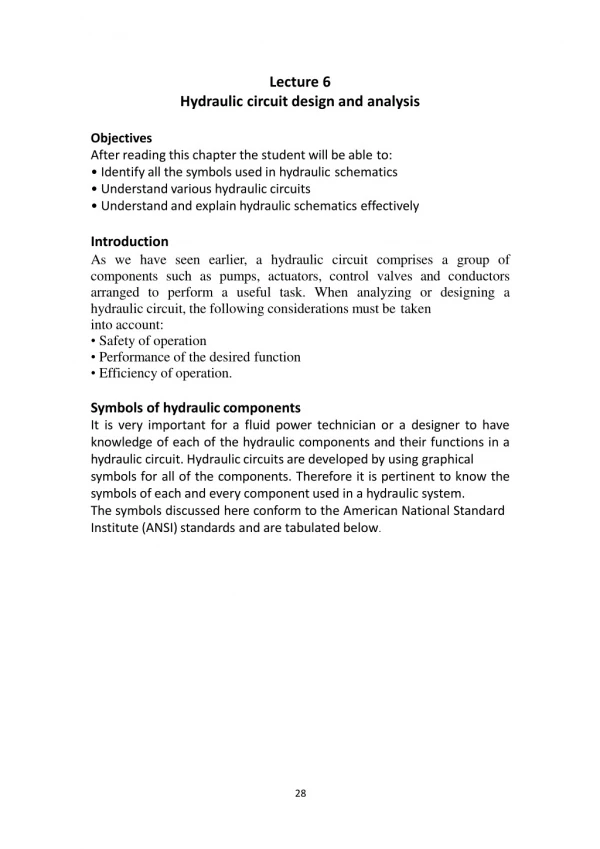
The Tanzania agriculture survey • Here is a second example • From the Tanzania agriculture survey • Page 2 of their technical guide • The details are less important, • than that the objectives are stated carefully • and justify the questions in the study questionnaire
Overall statement: Sample census objectives • The 2003 Agriculture Sample Census was designed • to meet the data needs of a wide range of users • down to district level • including policy makers at local, regional and national levels, • rural development agencies, funding institutions, • researchers, NGOs, farmer organisations, etc. • As a result the dataset is both more numerous • in its sample and detailed in its scope • compared to previous censuses and surveys. • To date this is the most detailed Agricultural Census carried out in Africa
The sample census was carried out to: • Identify structural changes • if any, in the size of farm household holdings, crop and livestock production, farm input and implement use. • Determine if there are any improvements in rural infrastructure • and the level of agriculture household living conditions; • Provide benchmark data on production and agricultural practices • in relation to policies and interventions promoted by the Min. of Agriculture • and Food Security and others stake holders. • Establish baseline data for the measurement of the impact • of high level objectives of the Agriculture Sector Devt Programme (ASDP), • National Strategy for Growth and Reduction ofPoverty (NSGRP) • and other rural development programs and projects. • Obtain benchmark data to address specific issues, such as: • food security, rural poverty, gender, • agro-processing, marketing, service delivery, etc.
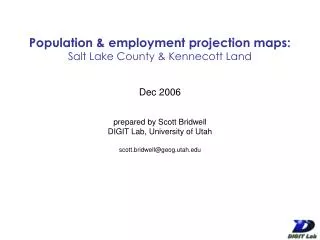
Analysis to meet objectives • Overall reports have been produced • In addition, the data can be used for a wide range of objectives • The practical assumes 2 NGOs • with particular questions • One is on food security • The other is on energy for lighting
Food security Why is a pie chart a reasonable type of display?
Food security by district Why might a stacked bar chart be appropriate?
Energy use for lighting Required 1. Decreasing order 2. With small categories combined
Finally: Are you now able to • Provide some principles • that characterise good tables and graphs • Use these principles • to recognise examples of good practice • Suggest reasoned improvements • for tables and charts • Provide examples of improved presentations • Be able to extract points • from a table or graph for a talk or a report
In the next session these ideas are applied to numeric variables