Download
1 / 14
140 likes | 270 Vues
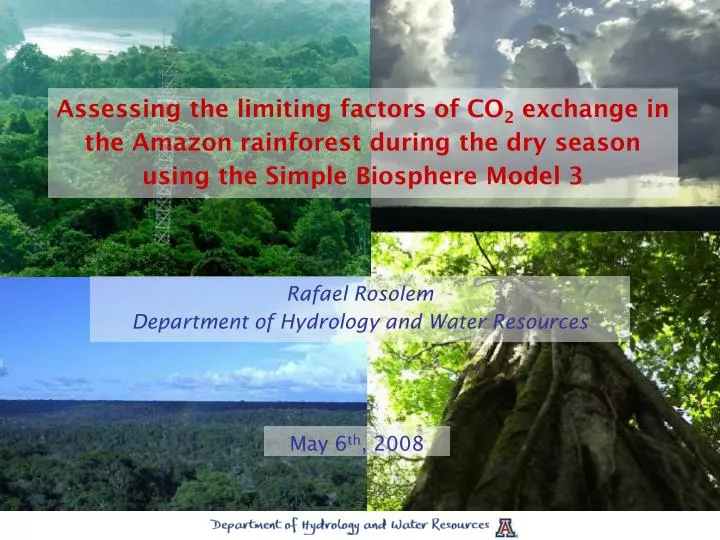
Assessing the limiting factors of CO 2 exchange in the Amazon rainforest during the dry season using the Simple Biosphere Model 3. Rafael Rosolem Department of Hydrology and Water Resources. May 6 th , 2008. Motivation. Saleska et al. 2003 (Science). Myneni et al. 2007 (PNAS). Motivation.

E N D
Assessing the limiting factors of CO2 exchange in the Amazon rainforest during the dry season using the Simple Biosphere Model 3 Rafael Rosolem Department of Hydrology and Water Resources May 6th, 2008
Motivation Saleska et al. 2003 (Science) Myneni et al. 2007 (PNAS)
Motivation Nemani et al. 2003 (Science)
Hypothesis • - No water stress is observed during the dry season because deep roots can still extract water from the soil; • Dry season = less cloud development; as a result more incoming solar energy to the vegetation which enhances photosynthesis. How to solve this issue? Vegetation phenology Soil-water dynamics Available water depth Stockli et al. (in preparation)
Objective • Identify the mechanisms associated with the dry season “green-up” of the Amazon rainforest using a widely known land surface parameterization scheme; • - Understand the soil-water dynamics component of the model;
Site location Located at FLONA (“FlorestaNacional”) Tapajós (lat/lon 3.01 S / 54.58 W); Vegetation: tropical humid forest on a broad flat plateau; The soil is mainly clay with some patches of sandy soil
Simple Biosphere 3 (SiB3) – Colorado State University New Features: - Prognostic T, e, CO2, other tracers in “canopy air space”; - 10-layer soil (T and w), with adjustable water extraction profile (roots); - Snowpack of 0-5 layers; - Mixed canopy physiology (e.g., savanna); and - Stable isotope fractionation of CO2. Adapted from Dr. Denning slides
Model configuration • Forcing data: Temp. (oC), q (g kg-1), U (m s-1), Press. (hPa), Sdown (W m-2), Ldown (W m-2), and Prec. (mm hr-1): 1 hr timestep available from Jan/2001-Dec/2003; • Highly parameterized scheme (36 parameters + 8 time-varying inputs); • Soil and veg. type dependent parameters: SiB2 look-up tables applied to UMD vegetation and FAO soil maps; • biophysical parameters and time-varying inputs: global version of the 1982-2001 European Fourier-Adjusted and Interpolated NDVI (EFAI-NDVI): 20 year long NASA/NOAA AVHRR Pathfinder NDVI data (10-day temporal and 0.1 degree spatial resolution) at http://www.iac.ethz.ch/staff/stockli/efaindvi_page/efaindvi.html; • No model calibration and validation experiments: LARGE SOURCE OF UNCERTAINTY!!! • 30-yr spin-up has been applied to stabilized soil moisture and carbon quantities in the model;
Simulation experiments Control Saturation Saturation - Control
Results: Monthly con sat
Results: Cumulative NEE con sat - con
Conclusions • Control experiment fails to simulate the energy partion (H and LE); • Simulation is clearly improved in the dry season when water is available at the bottom layers: energy partition is improved!!! • Saturation experiment: available energy becomes the only limiting factor in the Amazon rainforest (consistent with past studies); • Model calibration MUST be performed (e.g, diurnal pattern of gorund heat flux); • At the end of the 3 years, the saturation simulation uptakes approximately 30% more carbon (0.25 g m-2 s-1) than the control experiment; • IMPORTANT: This study is just a QUICK FIX to the issue of Amazon “green-up”; the best approach is actually to incorporate a powerful phenology prognostic model and develop a rooting dynamics formulation to account for water extraction under stress conditions;