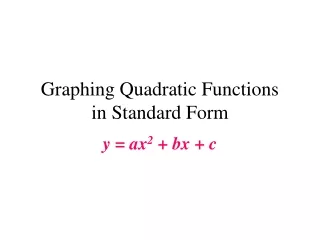
Graphing Quadratics in Standard Form: Step-by-Step Guide
40 likes | 171 Vues
Learn how to graph quadratic equations in standard form, ax² + bx + c. This guide explains the process of finding the vertex, calculating the x-coordinate, and using this value to determine the corresponding y-coordinate. You'll discover how to graph the vertex and utilize the 'a' value as the slope to create the parabolic curve. For example, we'll graph y = 2x² - 8x + 6, starting at x = 2 and finding values on either side. Master the techniques for visualizing quadratic functions with ease!

Graphing Quadratics in Standard Form: Step-by-Step Guide
E N D
Presentation Transcript
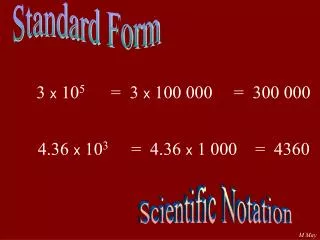
Standard Form ax2 + bx + c • To graph: • Find the vertex • The x-coordinate of the vertex is at • Plug this x value into equation to find y • Graph the vertex • Use a as the slope to move from vertex
Example 1: Graph y=2x2-8x+6 • Start table at x=2 and find values on either side • Vertex: use b=-8 and a=2 x=2