Mastering Quadratic Function Graphing
100 likes | 124 Vues
Learn to graph quadratic functions efficiently using vertex formula and standard form equations. Fill in tables, plot coordinates, and connect points to create parabolas. Multiple step examples provided.

Mastering Quadratic Function Graphing
E N D
Presentation Transcript
Unit 7 QuadraticsGraphing Quadratic Functions Goal: I can graph quadratic functions and show intercepts, maxima and minima. (F-IF.7a)
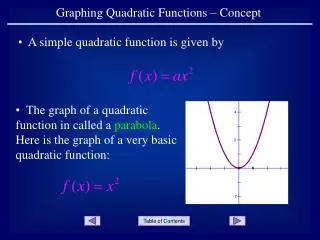
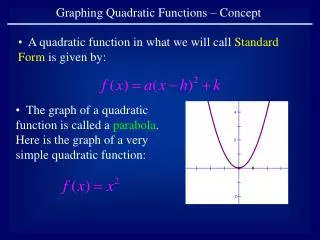
Graphing a Quadratic Function in standard/function form y = ax²+bx+c • Step 1 Write • Step 2 Find • Step 3 Make • Step 4 Plot the x-coordinate of the vertex, which is a table of values, using x-values to the left and right of the vertex the points and connect them with a smooth curve to form a parabola
EXAMPLE 1 Fill in the table of values to graph the quadratic 1. Standard Form: 2. Find the x and y-coordinate of the vertex: y -coordinate y = (3)2– 6(3) + 5 y = 9 – 6(3) + 5 y = 9– 18+ 5 y = – 4 vertex: (3, -4)
EXAMPLE 1 Fill in the table of values to graph the quadratic. 2. Make a table of values: 1 0 y = (1)2– 6(1) + 5 -3 2 y = (2)2– 6(2) + 5 3 -4 y = (4)2– 6(4) + 5 -3 4 0 5 y = (5)2 – 6(5) + 5
EXAMPLE 1 Graph Quadratic Function 1 0 -3 2 3 -4 -3 4 0 5
EXAMPLE 2 Fill in the table of values to graph the quadratic 1. Find the x-coordinate of the vertex: y -coordinate y =-2 (0)2+ 6 y =-2 (0) + 6 y =(0) + 6 y = 6 vertex: (0, 6)
EXAMPLE 2 Fill in the table of values to graph the quadratic. 2. Make a table of values: -2 -2 y = -2(-2)2+ 6 4 -1 y = -2(-1)2+ 6 0 6 y = -2(1)2+ 6 4 1 y = -2(2)2+ 6 -2 2
EXAMPLE 2 Graph Quadratic Function -2 -2 4 -1 0 6 4 1 -2 2
You try… Find the x-coordinate of the vertex: