Download
1 / 1
20 likes | 159 Vues
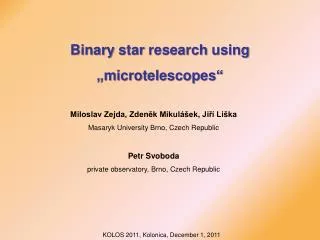
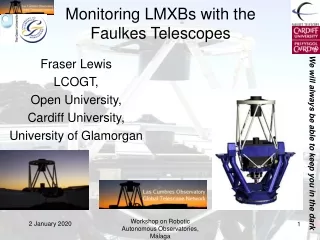
This image taken with the Faulkes Telescope shows NN Ser circled. The Faulkes Telescope North at Sunset. Image courtesy of The Faulkes Telescope Project. OBSERVATION OF THE BINARY STAR NN SER USING THE FAULKES TELESCOPE Anne O ’Leary –Sacred Heart Grammar School Newry. ABSTRACT

E N D
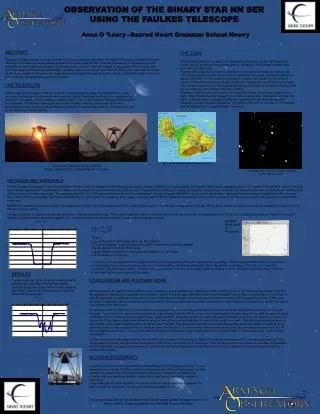
This image taken with the Faulkes Telescope shows NN Ser circled • The Faulkes Telescope North at Sunset. • Image courtesy of The Faulkes Telescope Project OBSERVATION OF THE BINARY STAR NN SER USING THE FAULKES TELESCOPE Anne O ’Leary –Sacred Heart Grammar School Newry ABSTRACT My project is based on the research carried out during a five week placement at Armagh Observatory. I used the Faulkes Telescope in Hawaii to observe several eclipses of the binary star NN Ser. This was recorded by CCD camera, and the images were then used in photometry (the measurement of light), to find the change in magnitude of NN Ser over time. From the values gained through photometry, I plotted a light curve using Excel. From this light curve I was able to find the length of an eclipse. The Faulkes Telescope was used to capture images during the eclipse of NN Ser in order to find out how accurately the telescope could time the event. THE STAR. NN Serpentis (NN Ser) is a star in the constellation Serpens. It is 600 light years from Earth, and is a seventeenth magnitude star i.e. it is approx 16000 times too faint to be seen with the naked eye. The star, NN Serpentis is in fact, not one star but two and so is known as a binary star. One of these stars is a white dwarf, a very small dense star with a surface temperature of approx 70,000oC. The other star is a red dwarf, a lighter, less dense (and so larger in volume) star with a temperature of approx 2000oC. However, as the stars are so far away, they remain unresolved (i.e. they appear as a single point) and any interaction between the stars is observed as a change in the light emitted. The stars in NN Ser orbit one another, and regularly eclipse one another relative to the earth. When the dimmer star passes in front of the brighter one, it blocks it from view The light is reduced to such a degree that the star appears to all but the most sensitive telescopes to have vanished altogether. The period of the orbit of the stars is 187 minutes, and the eclipse lasts for approximately 11minutes. THE TELESCOPE As the length of the eclipse of NN Ser is known, it can be used to gauge the capabilities of a new telescope. In this case, the telescope used was the Faulkes Telescope North which is located on the mountain of Haleakala, on the Hawaiian island of Maui. There is also Faulkes Telescope South, which is in Australia. The Faulkes Telescopes are research quality reflecting telescopes which were constructed to make research grade resources available to schools and students. The telescopes can be controlled live via the internet. Map of Hawaii Showing Maui in Detail METHODS AND MATERIALS In order to use the telescope to time the eclipse of NN Ser, I used live sessions on the telescope to capture images of NN Ser during an eclipse. The Faulkes Telescope is equipped with a CCD camera. This contains a piece of silicon which detects light through the photoelectric effect, which causes it to emit electrons when light falls on it. These electrons build up in individual photosites, and during processing, the number of electrons is counted and is related to a certain intensity or brightness of light. The image produced by the CCD camera can then be used for photometry. I used the program AIP4WIN to carry out the photometry. I wished to find the change in magnitude of NN Ser over time. This is done by comparing the brightness of NN Ser to other stars in the image. As time passes, the brightness of NN Ser drops as it is eclipsed and then rises back to its original level as the hot star emerges from behind the cooler one. AIP4WIN creates a record of the change in brightness and this file can be transferred to Excel in order to plot a graph of the change in magnitude of the star. This graph is known as a light curve and an example of the light curve of NN Ser is shown below. In order to achieve a reliable and accurate light curve, I had several sets of data. These sets of data then have to be combined in order to provide one complete light curve. To do this, the light curve must be a graph of change in magnitude against phase rather than against time. In order to convert my times to phases, I had to use the equations below: AIP4WIN Being Used For Photometry teclipse = T0 + P.n ø = (t - teclipse)/P Where: teclipse is the time in Julian days when the star eclipses. T0 is the ephemeris , a known time in the Julian calendar when the star eclipsed. P is the period of the star (187minutes) n is the number of cycles that have occurred between the two times. ø is the phase of the eclipse. In order to use these equations, the dates and times of the observations had to be converted to Julian days. Then an approximate value for n was found by rearranging the formula and using a time from my observations which was estimated to be in the middle of an eclipse. This value for n was then rounded to give the integer number of cycles that had occurred. From this, an accurate value for teclipse is found. Using the second formula, the times of my observations were converted to phases. RESULTS The light curve plotted by Excel is shown below. In some places, data was missing these points occurred during the eclipse and so I have replaced them with a value of ten, the maximum that could reasonably be expected. CONCLUSIONS AND FURTHER WORK When comparing the sample curve with the curve I obtained, several problems are highlighted. First is that the curve is not flat during the eclipse. This can be explained by looking at the process of photometry. The star’s drop in magnitude was found by comparing NN Ser to other, constant stars in the image. A drop in magnitude, or dimming is found when fewer photons are recorded per pixel. However, with fewer photons, a drop in accuracy occurs. In this case, the drop in magnitude was very large and so the number of pixels recorded was very small, therefore the percentage inaccuracy was very large. This lead to unevenness in the light curve. It is also seen that the light curve is not centred at phase equal to zero. This is due to the fact that I have not included Barycentric corrections in my data. Because the earth is in constant orbit around the sun, the distance from the NN Ser to the earth, and therefore the time taken for the light to reach the earth constantly varies. In order to give accurate timings, many prediction times and records of events are given as the time they occur as viewed from the sun or barycentre. This creates a difference between the given time of the event and the time the event is observed from earth. This difference varies between my sets of data as the earth’s position relative to the sun has changed. They Barycentric corrections involved taking away a certain number of seconds to my observed times in order to convert them to times as seen from the sun.I found that when I attempted to do this, the data correlated less and that it did not become significantly centred. The problems with the Barycentric corrections may indicate that the timing mechanism of the telescope may require further investigation. Further work may include observation of the star with longer exposure time during the eclipse to investigate how much the curve would be improved. The investigation might also include further investigation of the timing mechanism of the telescope. If the timing is found to be sufficiently accurate, it is possible that the telescope may be appropriate for use in conjunction with other telescopes around the world in order to provide a continuous stream of data for a research astronomer. ACKNOWLEDGEMENTS I would like to thank all the staff at Armagh Observatory for their patience and help. I would especially like to thank: Dr Simon Jeffery my supervisor who did everything possible to help me with my project; Amir Ahmad who helped in Dr Jeffery’s absence; and Apostolos Christou who also sacrificed his time in aid of my project and my general education in astronomy. I would also like to thank the staff at the control centre for the Faulkes Telescope and the staff in Hawaii for their help in making the telescope available to me. This project was carried out at the Armagh Observatory under the supervision of Dr Simon Jeffery. It was supported by a Nuffield Science Bursary.