Download
1 / 19
190 likes | 347 Vues
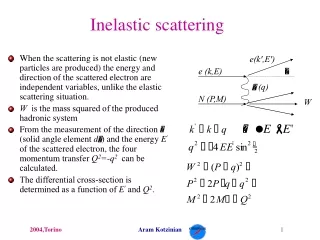
Inelastic X-ray scattering in strongly correlated (Mott) insulators. T. P. Devereaux. With J. Freericks (Georgetown). Work supported by NSERC and PREA. Quantum Critical Points. Cuprates phase diagram. one particle properties may be uncritical, two particle properties may not. EXAMPLE:

E N D
Inelastic X-ray scattering in strongly correlated (Mott) insulators T. P. Devereaux With J. Freericks (Georgetown). Work supported by NSERC and PREA. T. P. Devereaux
Quantum Critical Points Cuprates phase diagram • one particle properties may be uncritical, two particle properties may not. • EXAMPLE: • (Anderson) metal-insulator transition • 1/t , DOS – non-critical, s - falls to zero at MIT. T. P. Devereaux
Experimental data for the cuprates Irwin et al, 1998. • reduction of low-frequency spectral weight • increase in the charge transfer peak • isosbestic point at about 2100 cm-1. T. P. Devereaux
Common to other systems? FeSi – Kondo Insulator SmB6 – mixed valent insulator • transfer of spectral weight from low frequencies to high as T reduced. • occurrence of “isosbestic point” (spectrum independent of T). • qualitatively similar to B1g in underdoped cuprates. T. P. Devereaux
Low energy features. F. Venturini et al, 2002. T. P. Devereaux
Shows a clear break in behavior at a doping pc ~ 0.22. Indicates that the “hot” qps become incapable of carrying current. -> unconventional quantum critical metal – insulator transition forp=pc. Venturini et al, 2002. T. P. Devereaux
Inelastic X-ray scattering M. Hasan et al, 2001 – Ca2 Cu O2 Cl2 • non-dispersive peak ~ 5.8 eV • weak, dispersive peak ~ 2.5-4 eV • which features are associated with excitations across a Mott gap or band transitions? • Why would an excitation across a Mott gap show dispersion? T. P. Devereaux
La2CuO4 – Kim et al., 2002 T. P. Devereaux
Light scattering processes Incoming photon wi Costs energy U (charge transfer energy). Outgoing photon wf For finite T, double occupancies lead to small band of low energy electrons. Electron hops, gains t. T. P. Devereaux
Metal-Insulator transition Falicov Kimball model d=∞ • Correlation-induced gap drives the single-particle DOS to zero at U=1.5 • Interacting DOS is independent of T in DMFT (Van Dongen, PRB, 1992) • Examine Raman response through the (T=0) quantum phase transition. T. P. Devereaux
Exact results: Falicov-Kimball Fixed Temperature Fixed U=2t Spectral weight shifts into charge transfer peak for increasing U or decreasing T. Charge transfer peaks. • Spectral weight shifts into charge transfer peak for increasing U. • Low frequency spectral weight ~ t2/U. Charge transfer peaks. small band of qps T. P. Devereaux
Integrated spectral weight and inverse Raman slope • The Raman response is sharply depleted at low-T. • The inverse Raman slope changes from nearly constant uncorrelated metallic behavior to a rising pseudogap or insulating behavior as the correlations increase. T. P. Devereaux
Inelastic X-ray results U=4, n=1 • high energy peak – dispersionless charge transfer excitation ~ U. • low energy peak is strongly temperature dependent. T. P. Devereaux
Peak positions and widths Low energy peak High energy peak Filled symbols – peak positions. Open symbols – peak widths. T. P. Devereaux
Exact results for Hubbard model d=∞Nonresonant B1g Raman scattering (n=1,U=2.1) • Note the charge transfer peak as well as the Fermi liquid peak at low energy. As T goes to zero, the Fermi peak sharpens and moves to lower energy. • There is no low energy and low-T isosbestic point, rather a high frequency isosbestic point seems to develop. T. P. Devereaux
Nonresonant B1g Raman scattering (n=1,U=3.5) • A MIT occurs as a function of T. Note the appearance of the low-T isosbestic point. • The low energy Raman response has rich behavior, with a number of low energy peaks developing at low-T, but the low energy weight increases as T decreases. T. P. Devereaux
Nonresonant B1g Raman scattering (n=1,U=4.2) • Universal behavior for the insulator---the low-energy spectral weight is depleted as T goes to zero and an isosbestic point appears. • The temperature dependence here is over a wider range than for the FK model due to the T-dependence of the interacting DOS. T. P. Devereaux
X-ray results Hubbard Model T. P. Devereaux
Summary and Conclusions • Shown some exact solutions for Raman scattering across a MIT. • Insulating state, depletion of low energy spectral weight into charge transfer peak – universal behavior. • Metallic state, development of low energy peak reflecting qp coherence. • Elucidates dynamics near and through a quantum critical point. T. P. Devereaux