Download
1 / 172
1.72k likes | 1.75k Vues
Explore the history and practical applications of the Decennial Census, including its use in public health, urban planning, marketing, politics, and more. Learn about census questions over time, data sources, and how it influences various aspects of society.

E N D
Decennial CensusA Base for Community Analysis Grace York University of Michigan October 2003
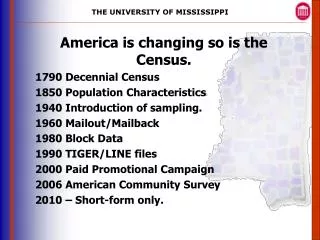
Census History • Survey of the United States population every 10 years • Mandated by Constitution • Purpose: reapportionment of 435 seats in the House of Representatives
Census Questions Vary Over Time • Total population, race, sex in 1790 • Feeble-minded in 1840-1890 • Income first asked in 1940 • Televisions surveyed, 1950-70 • Detailed ancestry beginning 1980 • Multiple races and grandparents as caregivers in 2000
Census Questions Vary Over Time • Reflects changes in society • In 1990 and 2000 Congress wanted to reduce paperwork • Grid of questions, 1790-2000 http://www.lib.umich.edu/govdocs/census2/censubj.pdf
Practical Applications for Census Data • Public health professionals identify vulnerable populations for chronic disease • Urban planners identify zoning, housing, sewage, and transportation issues • Social workers conduct needs assessments for services to the elderly, poor, children
Practical Applications for Census Data • Marketers target likely buyers • Politicians use the census to determine voting districts and to assess constituent interests • Environmentalists map the spread of toxic effluents and population densities
Practical Applications for Census Data • Occupation by age, race, and sex for equal employment opportunity • Librarians base collection development policy on community characteristcs • Mayors use numbers to apply for federal grants. • Undercount costs money – the reason for lawsuits • Racial minorities and undocumented aliens • Should missionaries be counted as U.S. residents
Outline of Presentation • Census Questionnaire • Census Geography • Reference Maps • Census Data • Thematic Mapping • Historic Data
Reference Tools Census Toolkit http://www.lib.umich.edu/govdocs/census2/centool.pdf Historic Census Questions http://www.lib.umich.edu/govdocs/census2/censubj.pdf
2000 Questionnaires100% and Sample 100% Questionnaire • Age • Sex • Race (Multiple) • Hispanic origin • Household relationship • Occupied v. vacant housing units • Owner v. renter occupied housing
Primary Uses of Short Form Data • Race and sex for single years of age to 99; three groups after 100 • Most detail by race (250 groups total)
Race Groups in 2000 • White • Black or African-American • American Indian or Alaskan Native • Asian • Hawaiian or Pacific Islander • Other • Two or More Races (Based on Self-Identification)
Individual Races • Some files break the 6 racial groups into 250 specific categories • Includes Chippewa Indians, Hmong, Pakistanis • Israelis, Arabs, Iranians and Afghanis are considered as white (broken out as ancestry in sample data) • Racial definitions appear at: http://www.lib.umich.edu/govdocs/census2/ sf3td/sf3tdg7.pdf
Hispanic Not considered a race Can be Hispanic and any race Breakdowns in some tables • Cuban • Puerto Rican • Mexican • Spanish • Various Latin American Countries
Calculating Minorities Subtract White Non-Hispanic from White Alone to get White Hispanic; then add WH and WNH to other races OR Subtract White, Non-Hispanic from total population to get total minority population Total Michigan 9,938444 White Non-Hispanic -7,806,691 Minority = 2,131,753
New Race Category in 2000 Respondents could choose up to SIX racial backgrounds Typical mixed race is 2-3% of population Race data not necessarily comparable with previous censuses
Household Relationships Relationship to Householder • Spouse • Child • Stepchild • Grandchild • Brother/Sister • Parent • Non-relative • Unmarried partner is separate category
Group Quarters • College dorms • Prisons • Mental hospitals • Shelters for abused spouses • Military barracks • Nursing homes
100% Questionnaire Data Reports Pre-Tabulated Data • Summary File 1 – most age, race, sex data to the smallest geographies, block and block group • Summary File 2 – same data by 250 races to neighborhood (tract) level
2000 Sample Questionnaire(generally 1/6 of population) • Marital status, housing value and rent (100% in 1990) • Grandparents as caregivers (new) • Ancestry • Language • Country of origin • School enrollment and educational attainment (and dropouts)
2000 Sample Questionnaire • Employment • Industry and occupation • Transportation to and place of work • Disability and mental illness • Veteran status • Income and poverty
Sample Data Products Pre-Tabulated Data • Summary File 3 – socio-economic and housing characteristics to census tract or block group level • Summary File 4 – same data as Summary File 3 for 210 racial and 125 ethnic groups to tract level
Public Use Microdata Samples(not on Factfinder) Samples of the samples at 1% and 5% levels Create your own tables using raw data For 2000 currently requires statistical package such as SAS, SPSS, STATA Larger geographies: states, metro-areas, PUMAS and super PUMAS (contact JoAnn Dionne - jdionne@umich.edu - about access and alternative software programs)
Special Tabulations(not on Factfinder) School District Data File (Available) Sample data for children, parents and families with school-age children for school districts http://nces.ed.gov/surveys/sdds/index.asp Equal Employment Opportunity File (Fall 2003) Sex and race for 472 occupational groups for places of 50,000+ http://www.census.gov/hhes/www/eeoindex.html
Special Tabulations(not on Factfinder) Census Transportation Planning (In Progress) Commuting and place of work data for counties, minor civil divisions, and traffic analysis zones http://www.census.gov/population/www/cen2000/commuting.htmlhttp://www.census.gov/population/www/cen2000/mcdworkerflow.html http://www.trbcensus.com/ Special Tabulation on Aging (2004) Sample data cross-tabulated by age for people 55+ for places of 2500+
Importance of 100% and Sample Surveys • 100% and sample data on the same subject (e.g. race, age, total pop, housing) don’t always match • Ann Arbor 100% = 114,024; Sample =114,110 • If one variable comes from sample data, try to get all variables from sample data • Only 100% data used at block level • Sample data to only to tract or block group level • Larger the area, the more detailed the subject variables
Census Geography Legal Areas • Nation • State • Counties • Cities • Townships • Congressional Districts • School Districts
Census Geography Census-Designated Areas • Metropolitan Statistical Area • Urbanized Area and Urban Cluster • Census Tract • Block Group • Block • Zip Code Tabulation Area • PUMAS/Super-PUMAS • Traffic Analysis Zones
Urban Areas • Urbanized = Densely settled area, 50,000+ • Urban Cluster = Densely settled area, • 2500-50,000; can be outside metro area South Central Michigan has a surprising number of urban clusters
Metropolitan Statistical Area • Central city of 50,000 or more • Its own county, and • Surrounding counties with • heavy commuting patterns
Metropolitan Area Definitions • Metropolitan Statistical Area - stand-alone metro area • Primary Metropolitan Statistical Area - metro area which is component of larger metropolitan area • Consolidated Metropolitan Statistical Area - two or more contiguous metropolitan areas
Detroit Consolidated Metropolitan Statistical Area 1990 Lapeer Livingston Detroit PMSA Macomb Monroe Oakland St. Clair Wayne Ann Arbor PMSA Washtenaw 2000 Lapeer Macomb Detroit PMSA Monroe Oakland St. Clair Wayne Lenawee Ann Arbor PMSA Livingston Washtenaw Flint PMSA Genesee
MSA Definitions This is very complicated Just consult the definitions when you need them http://www.census.gov/population/www/estimates/metrodef.html
Census Tracts • Areas of about 4000 people • Approximate neighborhoods
Block Group Two – eight block groups per tract All 2000s (2001, 2002, 2003) are BG 2 Smallest area for sample data
Blocks All blocks in 2000 have 4-digit numbers Some 100% data but no sample data
PUMAS and SUPER-PUMAS For Public Use Microdata Samples http://ftp2.census.gov/geo/maps/puma/
PUMAS and SUPER-PUMAS American Factfinder Reference Maps http://factfinder.census.gov/
Locating Census Maps • American Factfinder • http://factfinder.census.gov/ • Census Bureau Web Site (PDF) • http://ftp2.census.gov/plmap/ • Documents Center Paper Copies • Tract maps for Michigan • Block maps for Wayne and Washtenaw • Arcview GIS Program in Map Library
Technical Documentation • Geographic and subject definitions • Lists of tables and individual components in tables • Code lists (ancestry, race, occupation, group quarters, Hispanic, industry, language, country) • Original questionnaire • http://www.lib.umich.edu/govdocs/census2/sf1td.html • http://www.lib.umich.edu/govdocs/census2/sf3td.html
Census Data Formats2000 FTP • Transfer all data for all geographies in a county and manipulate with SAS or SPSS http://ftp2.census.gov/plmap/ http://ftp2.census.gov/census_2000/ American Factfinder http://factfinder.census.gov/ • Prepared profiles • Data extraction to a spreadsheet, • Reference and thematic maps
Census Data Formats2000 Census Bureau CDs/DVDs Quicker than American Factfinder for extracting very large data sets Geolytics CD-ROMS • Thematic mapping for all variables and created variables; for 1970, 1980, 1990, and 2000 • Neighborhood Change Database (1970-2000) coming? • Maps can be imported into more sophisticated programs
Initial Factfinder Screen http://factfinder.census.gov/
Basic Facts http://factfinder.census.gov/ Brief profiles and geographic comparisons for U.S., states, counties, and places
Geographic Area • If you know the geographic area or proceed directly toDATA SETS or Profiles • If you need to determine the geographic area, go toREFERENCE MAPS
REFERENCE MAPS • Internet Explorer 5+ works best if you want to click and zoom • Choose Breadcrumbs/Geographyforthree better options