Analysing Graphs of Linear Relations
180 likes | 326 Vues
Analysing Graphs of Linear Relations. Lesson 9.1. Terms. Relationship. Terms. Relationship Is a pattern formed by two sets of numbers. 2. Table of values. 2. Table of values - is a chart showing two sets of related numbers. 3. Expression. 3. Expression

Analysing Graphs of Linear Relations
E N D
Presentation Transcript
Analysing Graphs of Linear Relations Lesson 9.1
Terms • Relationship
Terms • Relationship • Is a pattern formed by two sets of numbers
2. Table of values - is a chart showing two sets of related numbers
3. Expression Any single number, single variable or combinations of operations ( +, -, X, /) involving numbers and variables. Does not include an equals sign eg – 5, 5a, x + 9, 2y-7
Equation - A mathemtical statement ith two expressions that have the same value and are separated by an equals sign Eg. 2t-4= 10
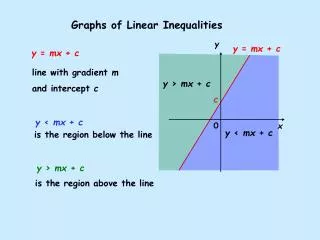
4. Linear relation • A pattern made by a set of points that lie in a straight line
Variable a letter that represents an unknown number Eg in 3a – 5, a is the variable
Formula a mathematical statement that represents the relationship between specific quantities. D=M/V