Understanding Relations and Functions in Coordinate Graphing
This lesson explores the concepts of relations and functions using coordinate graphing. Students will learn to represent relations through ordered pairs, tables, and graphs, distinguish between independent and dependent variables, and determine if a relation is a function. Key elements like domain and range, intercepts, and graph behavior will be discussed, along with the vertical line test for functions. By the end, students will be able to interpret graphs and identify critical points such as maxima, minima, and areas of increase or decrease.

Understanding Relations and Functions in Coordinate Graphing
E N D
Presentation Transcript
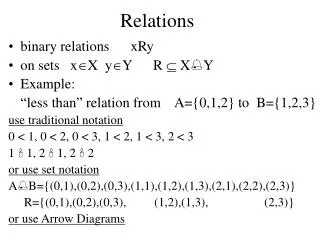
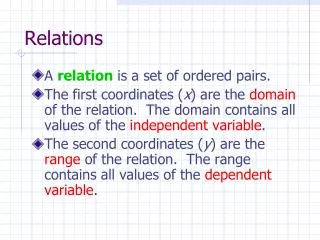
Day8 • Represent relations • Interpret graphs of relations Relations
Using a coordinate graph systemhttp://www.coolmath.com/algebra/08-lines/02-plotting-points-01.htm Coordinate system Ordered pairs (x, y) Quadrants I, II, III, IV Y- coordinate X- coordinate X-axis Y-axis
Representation of a Relation • Domain and Range • Ordered Pairs: (1,2), (-2, 4), (0, -3) • Table Graph Map
Representation of a Relation • Domain and Range • Ordered Pairs: (2,5), (-2, 3), (5, -2), (-1, -2) • Table Graph Map
What are three ways to represent a relation? * * * Show {(4, -3), (3,2, (-4,1), (0, -3)} as a relation in three ways.
Independent and Dependent variables • Identify the independent and dependent variables: • The committee is selling tickets to the Fall Ball. The tickets that they sell, the greater the amount of money they can spend for decorations. • Independent: Dependent: • Generally, the average price of going to the movies has steadily increased over time. • Independent: Dependent: • The air pressure inside a tire increases with the temperature. • Independent: Dependent: • As the amount of rain decreases, so does the water level of the river. • Independent: Dependent:
Interpreting graphs • http://www.wtamu.edu/academic/anns/mps/math/mathlab/beg_algebra/beg_alg_tut9_bar.htm
Functions Determine whether a relation is a function Find function values
What is a function? • A function is a relationship between input and out put. In a function there is exactly one output for each input. • A function is a relation in which each element of the domain is paired with exactly one element of the range • Domain Range -3 0 3 4 5 3 2 1
What is a function? • A function is a relationship between input and out put. In a function there is exactly one output for each input. • A function is a relation in which each element of the domain is paired with exactly one element of the range • Domain Range -2 0 3 4 -3 6 9 Is this a function – why or why not?
At an ice sculpting competition, each sculpture’s height was measured to make sure that it was within the regulated height range of 0 to 6 feet. The measurements were as follows: Team 1, 4 feet;; Team 2, 4.5 feet; Team 3, 3.2 feet; Team 4, 5.1; Team 5, 4.8. • Make a table Determine the domain and range of the function Write the data as a set of ordered pairs. Then graph the data data. • State whether the function is discrete or continuous.
Equations as Functions • -3x + y = 8 • Y = 8 + 3y • You can check If it is a function Using the vertical Line test
Discrete vs. continuous • Discrete Continuous • Use the vertical line test to check if it is a function.
Function notation • F(x) = -4x + 7 • F(2) F(-3) +1
h(t) = -16+ 68t +2 • h(4) 2[h(g)]
Assignment • Chapter Test – Thursday • Pp 44-46; 9-20, 40, 42-60 • Pp.51-54; 20-44, 49, 50,52,54-75
You identified functions and found function values. Identify and interpret key features of the graphs of functions.
Linear Graph that is a straight line. Non-Linear Graph that is not a straight line. Linear v.Non-Linear
X-intercepts The x-coordinate of the point at which a graph intersects the x-axis. Y-intercepts The y-coordinate of the point at which a graph intersects they-axis. Intercepts: Graph touches an axis
Line of Symmetry Each half of the graph on either side of the line matches exactly.
Relative Minimum Relative Maximum Extrema: Relatively high/low points
Positive Where the graph lies above the x-axis. Negative Where the graph lies below the x-axis. Positivev. Negative
Increasing Where the graph goes up. Decreasing Where the graph goes down. Increasingv. Decreasing
Describe/ label the following features of the function below: • Linear or Non-Linear? non-linear • x-intercept and y-intercepts? x=7.2 and y=30 • Line of symmetry? none • Positive/ negative? positive: 0 < t < 7.2 negative: t > 7.2 minutes • Increasing/ decreasing? increasing: t < 1, 4 < t < 6 decreasing: 1 < t < 4, t > 6 • Extrema? min: t = 4 max: t = 1 and t = 6 • End behavior? As x increases, y decreases. As x decreases, y decreases.
Describe/ label the following features of the function below: Non-linear • Linear or Non-Linear? • x-intercept and y-intercepts? x=5.5 and y=80 • Line of symmetry? • Positive/ negative? Positive: between x = 0 and x = 5.5 Negative: for about x > 5.5 • Increasing/ decreasing? Increasing: between x = 1 and x = 4 Decreasing:for x < 1 and x > 4 • Extrema? Maximum: at about x = 4 Minimum: at about x = 1 • End behavior? As x increases, y decreases. As x decreases, y increases. None
Activity • Draw a graph using at least 3 of the features discussed today. • In complete sentences on the back of the graph, explain how the three terms are demonstrated in the graph you drew.