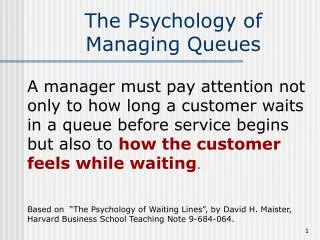
The Theory of Queues
230 likes | 413 Vues
The Theory of Queues. Models of Waiting in line. Queuing Theory. Basic model: Arrivals Queue Being Served Done Queuing theory lets you calculate: How long will it take an average customer to get done? How many customers are waiting, on average?. Why this is useful.

The Theory of Queues
E N D
Presentation Transcript
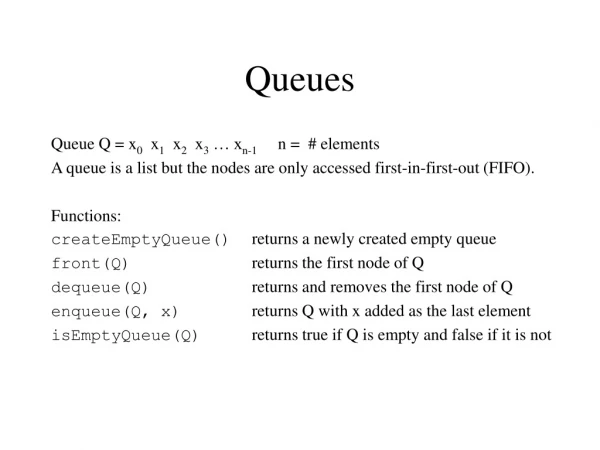
The Theory of Queues Models of Waiting in line
Queuing Theory • Basic model: • Arrivals Queue Being Served Done • Queuing theory lets you calculate: • How long will it take an average customer to get done? • How many customers are waiting, on average?
Why this is useful • How long will it take to get done? • Time allocation • For customers • For service • How many customers are waiting? • Space allocation • Social dynamic
Arrivals Queue Being Served Done • Jargon: • Queue < System • Queue is a subset of the System • System = In queue + being served
Arrivals Queue Being Served Done • λ (Lambda) – Average arrival rate • μ (Mu) – Average service rate • 1/λ = Average time between arrivals • 1/μ = Average time for service
Steady State --when average performance is not changing • λ Lambda – Average arrival rate • μ Mu – Average service rate • μ>λ – If the service rate is faster than the arrival rate, there is a steady state. • If λ>μ, there is no steady state. The queue will grow and grow.
Y a Q if λ<μ? • Why is there a queue if customers are served faster than they are arriving, on average?
Y a Q if λ<μ? • Why is there a queue if customers are served faster than they are arriving, on average? • Because of random variation in arrival and service times.
Randomness Modeled • Poisson distribution • - random variation with no limit • extremes are unlikely but possible • Event can happen at any time • Events are independent • We know the average rate of occurrence
Poisson distribution • Limit of the binomial • Cut t amount of time into smaller and smaller pieces • Only one arrival allowed during each piece. • The probability of an arrival during the piece is λ/N, where N is the number of pieces. • As N∞, the probability of x arrivals during t amount of time is …
Poisson distribution • Prob (x arrivals during time t) =
Assumptions for use of Poisson • Independent events • Average event rate doesn’t change
Poisson distribution • Application: Running total of Poisson distribution can show how much inventory is needed.
Exponential Distribution • Probability (next arrival during the next t amount of time)=
Exponential Distribution • Probability (server will finish current customer during the next t amount of time)=
Exponential Distribution example • If μ = 1 per hour, • Probability (server will finish current customer during the next hour) = 1 – e-1 • =0.632 • Half of the customers’ service takes less than 42 minutes.
Steady State • When the distribution of probabilities of various numbers in the system stabilizes • When startup conditions are far behind • λ<μ required for steady state to exist • ρ=λ/μ is how busy the server is • ρ is server busy time ÷ all time • ρ< 1 for steady state to be possible
Steady State • For single-server single-stage queue with Poisson arrivals and service: • Probability of n in the system (waiting or being served)= (1-ρ)ρn
Customers in System • L – customers in system = • Lq – customers in queue = ρL • These are averages, once the steady state is reached. • There are usually fewer in the system than L because the prob of n in system is skewed.
L=ρ/(1-ρ)=λ/(u-λ) • When the arrival rate nearly equals the service rate, the line can get very long. • If the arrival rate nearly equals the service rate, small changes in either rate can make a big difference.
Time in System • W – time in system = L/λ • Wq – time waiting to be served = ρW • These are averages, once the steady state is reached. • Most customers get through in less time.
W=L/λ=1/(u-λ) • When the arrival rate and the service rate are nearly equal, the wait can be very long. • When the arrival rate and the service rate are nearly equal, small changes in either rate can make a big difference.
Economic Analysis Weigh • The cost of waiting • Against -- • The cost of speeding up service or reducing arrivals.