Wildlife Management
Wildlife Management. By C. Kohn, Agricultural Sciences Waterford, WI. Extinction by Overharvesting. Overharvesting (or overhunting or overexploitation) is one of the main causes of human-caused extinction.

Wildlife Management
E N D
Presentation Transcript
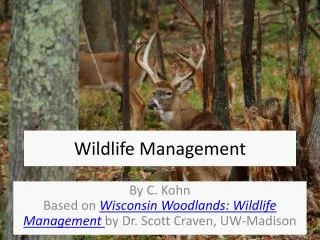
Wildlife Management By C. Kohn, Agricultural SciencesWaterford, WI
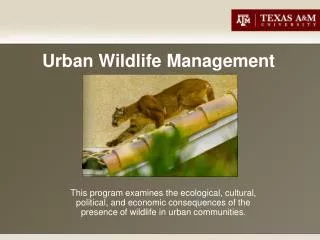
Extinction by Overharvesting • Overharvesting (or overhunting or overexploitation) is one of the main causes of human-caused extinction. • Overharvesting is perhaps the easiest-to-understand cause of extinction: overharvesting occurs when more individuals of a species are taken through hunting, fishing, or trapping (or other means) than can be replenished through the reproductive rate of that species. • For example, if a game preserve has 10 deer, and at most 5 fawns survive per year, you cannot shoot more than 5 deer without causing a local extinction of those deer. • While overharvesting is not the biggest source of human-caused extinction, it does represent one of the top four causes (along with habitat loss, pollution, and invasive species). • A key job of wildlife managers is to ensure that large enough populations of species exist to allow for a species’ continued survival. Source: edeify.com
The American Bison • The American Bison is a classic example of a species that nearly went extinct because of overhunting. • Prior to European settlement in North America, an estimated 60 million bison were found from Alaska to Mexico. • By 1890, less than 1000 individual bison remained due to widespread hunting, and the influence of railroads and the US government. • Due to the depend for bison pelts, and an intentional plan to exterminate the bison by the US government (in order to destroy the livelihood of American Indians), the bison very nearly was completely lost. • Today the bison is still listed as endangered by the US. • Only through strong conservation efforts by individuals such as Teddy Roosevelt has the bison been brought back from the brink of extinction. Source; craized.com
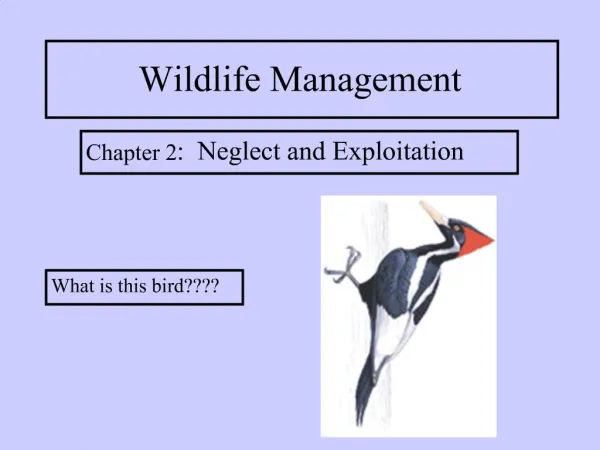
The Passenger Pigeon • The passenger pigeon was once had one of the largest populations of any bird on the planet. • Passenger pigeon individuals are believed to have made up 25-40% of all birds in the US totaling 3-5 billion birds when Europeans discovered America. • The passenger pigeon had flocks so large that at times they completely blocked out the sun during their migrations. • A single nesting area in Wisconsin covered 850 square miles and contained 136 million birds. • The passenger pigeon’s number began to decline as hunters began netting and shooting the birds to sell in city markets. • In Michigan in 1878, it was recorded that 50,000 birds were harvested per day for five months. • Within a matter of decades, one of the most numerous species on the planet would be completely extinct. • The last passenger pigeon died in the Cincinnati Zoo in 1914. • Prior to the extinction, no one believed that humans could cause a species with such an enormous population to go extinct. • The passenger pigeon remains a powerful example of the impact that can occur from unregulated harvesting by humans. • Wildlife management exists to ensure that examples like the bison and passenger pigeon do not continue to occur. • Wildlife managers work to ensure that populations of wildlife remain at sustainable levels. Source: www.thestory.org
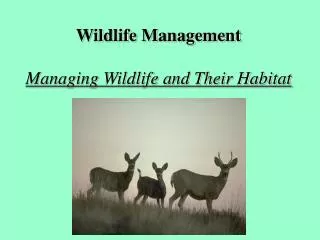
Role of Game Management • Aldo Leopold (considered the founder of the science of wildlife management) defined wildlife management as “the art of making land produce sustained annual crops of wild game for recreational use”. • Today we define wildlife management as the application of the science of ecology in order to benefit both wildlife and human needs. • Wildlife management seeks to balance the needs of wildlife with the needs of human populations to ensure the continued existence of wildlife species in the environment. • Wildlife, by definition, are undomesticated, free-ranging terrestrial vertebrates. • This includes fish, birds, mammals, reptiles, and amphibians. • Wildlife managers can affect wildlife populations through activities such as setting game limits, building and maintaining habitat, controlling invasive species, adjusting the flow of rivers and streams, public education, and other methods. Source: www.allposters.com
Why Manage Wildlife? • There are many who would argue that human interference only worsens problems for wildlife populations. • This is the basis for passive habitat management, in which an area of land is left untouched by human activity. • While this often sounds appealing, an unmanaged habitat is not necessarily a healthy habitat. • However, is a species has a population so low that they are at risk of extinction, human intervention may be the only way to save a species. • In order to prevent permanent ecological damage, human intervention is sometimes necessary. • Furthermore, unmanaged populations of wildlife often experience ‘boom and bust’ cycles in their populations. • The populations of most wildlife do not remain consistent. These population levels usually fluctuate between high and low extremes. Source: www.washingtonpost.com
Boom and Bust cycles • Many wildlife populations will naturally follow a Boom and Bust cycle. • This is where the population will continue to increase until a species has exceeded its carrying capacity. • When this occurs the population will experience a crash resulting in the loss of many individuals and a plummet in that species’ population. • Boom and Bust cycles are detrimental both to the species in which it is occurring and the habitat where that species is found. • Individuals of a species will usually experience high rates of disease and starvation after a boom in their population. • The habitat in which they are found will often be degraded by a boom population of the species. Source: mff.dsisd.net
Wildlife Management • A primary goal of wildlife management is to keep the population low enough through hunting or other measures to ensure that a boom and bust cycle does not occur. • This reduces the impact on the habitat vegetation while also reducing long-term suffering by individuals of a species. • Active Management involves the use of human activity to ensure that species of wildlife remain at healthy population levels. • There are two approaches to active management strategies: • Species Richness Approach: managing a habitat to maximize overall biodiversity. • This is a more ecologically-sound method; the higher the biodiversity, the more secure and sustainable a habitat will be. • Featured-species approach: this is where a biologist or landowner bases their decisions on the needs of a specific species. • This sometimes is done by private landowners for trophy game. • It can also be done to ensure population increases for threatened game. Source: soundwaves.usgs.gov
3 Focuses of Wildlife Mgmt • Wildlife management has three key focuses: • One focus pertains to actions that directly impact wildlife. • For example, establishing a deer hunting season has a direct impact on a deer population. • The second pertains to management of habitat. • This is probably the most important focus, as it has the most wide-ranging impact on the living species of an area. • The final area of focus is managing and maintaining a positive relationship with people who are affected by, use, or are involved with wildlife or habitat in an area. • An obvious example is capturing poachers who might illegally take wildlife, threatening their population. • This focus could also include activities such as public education, encouraging the wise use of natural resources, and preventing non-point pollution and other human-caused disturbances. Source: www.garyengbergoutdoors.com
Activities of Wildlife Mgmt • All activities related directly to wildlife fit three categories. • First, wildlife managers and environmental scientists must assess the population of important species. • Second, these individuals must determine the most appropriate goals for the health and population of important species. • Finally, managers and scientists must determine a course of action to meet their goals if needed. • For example, Wisconsin’s deer herd is an issue that requires extensive work by the DNR and scientists. • Wildlife managers must first estimate the size of the state’s deer herd. • Then, they must determine if this size is too big, too small, or at a sustainable level. • Finally, the DNR must set a harvest limit that will achieve their goal as it relates to the size of the population. Source: www.wisaf.org
Determining Population • Wildlife Managers have many methods of determining the population of a species. • These methods can range from complete counts (using visual and/or aerial surveys, a manager counts each animal individually), incomplete counts (counting the number of individuals in an representative area and multiplying to cover the entire area in question), indirect counts (in which calls, tracks, nests, or tracks are used), and DNA testing (where DNA is collected and analyzed to determine a species, particularly in aquatic populations). • One common method for determining a species’ population is the Mark-Recapture Method. • The Mark-Recapture method involves trapping and marking individuals in an area. • After a set period of time has passed, the traps are set again. • The proportion of animals trapped twice compared to the total number trapped can be used to determine the population in an area. Source: pbsg.npolar.no
Pheasant Example • For example, let’s imagine we are counting pheasant populations in the Waterford area. • We set traps and catch 12 birds, which we then tag. • These birds are released, and several weeks later we re-set the same traps. • On the second try we catch 12 birds. Of the 12 birds, 4 have been previously tagged. • This means that for this area, 4 out of 12, or 1/3 are tagged. • If 1/3 are tagged, and we tagged 12 total, that would mean that 12 is 1/3 of the total population for this area. • If we multiply 12 times 3, we’d get the total estimated population: 36 pheasants for the Waterford area.
Mark Recapture Equation • The Mark-Recapture Equation: • If N = the total population of individuals of a species in a given area, thenN = [1st catch] x [2nd catch] /[number caught twice] • For example, in our pheasant example – • We caught 12 the first time. • We caught 12 the second time. • We re-caught 4 the second time. • N = (12 x 12) / 4 • N = 144/4 = 36 • N = 36
Management Decisions • Once a population is known, wildlife managers can do one of three options: increase a population, decrease a population, or stabilize a population. • The option a wildlife manager would choose depends on the species, the habitat and the carrying capacity of that habitat. • A carrying capacity is the maximum number of individuals a specific habitat can support for a specific species. • If a species’ population is above the carrying capacity, that population is above can be supported by a habitat, and their population will have to be lowered. • If a species population is beneath the carrying capacity but suitable in size, a wildlife manager would want to sustain this level of population for that particular species. Source: www.algebralab.org
Carrying Capacities • Carrying Capacities are complex ideas. For example… • Carrying capacity changes with seasons • A carrying capacity will usually be lower in winter and higher in summer. • Carrying capacities are determined more by extremes. • While carrying capacities may increase during mild weather, they will decrease during extreme weather. • To determine a carrying capacity, a manager should consider when a species is most challenged by weather and the elements. • Exceeding a carrying capacity for a species will affect most or all other species in a habitat. • For example, overgrazing by an overly high population of whitetail deer will reduce plant biodiversity and reduce food for other species.
Carrying Capacities • One species can affect the carrying capacity of another species, especially if they are competing species or predator/prey species. • For example, introducing a pack of wolves will indirectly increase the carrying capacity for their prey because more individuals will be taken over the course of the year. • Carrying capacity will vary from year to year. • An overly harsh winter or a severe drought will reduce the carrying capacity of a habitat from the previous year. • The best option is to aim for an optimal carrying capacity, or the population for a species that could be sustained by conditions in any given year. Source: rundle10.wikispaces.com
Population Factors • A carrying capacity is not a set number – it is more of a general concept. • Most wildlife managers do not have a set limit for a species because carrying capacities are changing constantly. • Actual population size and the habitat’s carrying capacity are not the only factors that affect decisions about a species’ population. • Other factors include the survivorship curve of a species, predicted growth models, the size of the food chain in which the species exists, the presence of a contagious disease, predation, species-specific behavior, and whether or not the species is a keystone species for its habitat. • Management of wildlife is exceptionally complex as all living species in a habitat are interconnected. • You cannot change the population of one species without affecting all other species in a habitat in some way.
Survivorship Curves • A survivorship curve represents the number of individuals of a species that are alive at each stage of life. • A Type 1 survivorship curve reflects a species for which the death rate is highest at old age. • Humans have a Type 1 survivorship curve. Most mortality is after decades of life. • For this reason, these kinds of species tend to produce very few young at a very low rate. • A Type 2 survivorship curve is where the risk of death is similar at all stages of life. • A Type 3 survivorship curve is where most death occurs shortly after birth. • These kinds of species tend to produce large amounts of offspring to accommodate this factor. • For example, frogs produce large amounts of eggs and trees produce large numbers of seeds because most won’t make it to adulthood. Source: online.morainevalley.edu
Predicted Growth Models • With wildlife populations, growth can be predicted by two models: • Exponential Growth: this is the model in an ideal environment for a species in which their population growth occurs faster as the population grows larger. • In exponential growth, the graph of population resembles a J-curve. • Human populations currently are exhibiting exponential growth patterns. • Most populations cannot increase forever- all species are limited by carrying capacities and the size of their niche. • Logarithmic Growth: this model is a more realistic predictor because it incorporates the carrying capacity of a habitat. • Logarithmic growth exhibits an S-curve when graphed as the population size approaches the carrying capacity of the habitat. • As populations reach the carrying capacity, fewer resources are available per individual of a species, reducing their growth and reproductive rates. • However, while this is a more accurate predictor of population growth, most populations fluctuate wildly, especially if a population has boom and bust cycles of population growth. Source: www.tutorvista.com
K- and r-selection • Many species of wildlife exhibit density-dependent selection patterns that make the logistic growth model possible. • When populations of a species are high, these environmental conditions will favor traits that enable an organism to survive with few resources. • For example, when bluegill populations in a lake are too high, these conditions will favor smaller fish with low reproductive rates. • When populations of a species are low, these conditions favor traits such as large body size and higher reproductive rates. • This is why larger bucks tend to be found where deer populations are lower (all other factors being equal). • Selection for traits that enable a species to thrive at high-population conditions is called K-selection. • K is the symbol used in population equations for carrying capacities. • K-selection occurs as the species approaches the carrying capacity. • Selection for traits that enable a species to thrive at low population conditions is called r-selection. • r refers to the rate of increase in the samepopulation equations. • r-selection occurs when a species has little competition in its niche. Source: fp1.centurytel.net
Negative Feedback • The population growth rate of some species of wildlife will change as the population level changes. • Resource limitation in populations at the carrying capacity can reduce reproduction. • Often reproduction is one of the first functions to be shut down by an animal’s body during episodes of malnutrition. • For example, many species of songbirds will lay fewer eggs when food is more scarce. • Resource limitation and large population size can also increase the susceptibility of an organism to predation. • For example, trout often concentrate their feeding on insects with the highest population because they require less energy to acquire. • Intra-species territoriality and aggression canalso increase at higher populations. • For example, wood frogs will utilize cannibalism at high populations. Source: www.flyfishingfromscratch.com
Disease and Predation • While species of wildlife with high populations can self-regulate to an extent through negative feedback, often human intervention is necessary. • Often a species will continue to increase their population until they have exhausted their niche. This could cause the local extinction of other species in that niche. • Furthermore, some species are density-independent and do not exhibit traits that reduce their population at the carrying capacity. • A contagious disease may also provide reason for wildlife managers to decide to lower a species’ population. • For example, when Chronic Wasting Disease was found in southern Wisconsin, state wildlife managers used additional hunting seasons to lower the population. • This worked to slow the spread of the disease throughout the state, allowing the population to increase after the disease had regressed. • In some cases wildlife managers may want to ensure that some populations of species remain are always as low as possible. • This is especially true of invasive species. Source: www.wisconsinlab.com
Keystone Species • Wildlife managers must take extra precaution to ensure that populations of some species are kept at sufficient levels, possibly even at the expense of the populations of other species. • This is particularly true of keystone species in a habitat. • A keystone species is a species that is not necessarily abundant in a habitat but does exert a strong control on the structure and function of an ecosystem through their ecological niche. • This phenomenon was first observed in 1963 in an experiment involving sea starts and mussels. • When the sea stars were removed from a habitat, the populations of mussels took over the tidal pools and through competition eliminated most other species. • Without the sea stars as predators, the ecosystem eventually collapsed. • American bison also exhibit keystone characteristics. • Bison regulate the biodiversity of prairie grasses; when bison graze on grasses, they allow later-blooming flowers to emerge. • Bison ensure soil fertility through their manure. • Bison create small wetland habitats by creating shallow depressions that fill with water during rains(which is necessary for the reproduction of manyinsects and amphibians) • Bison aid in the reproduction of many plants by spreading seeds and pollen. Source: www.buffalofieldcampaign.org
Threatened & Endangered Species • If the population of a species becomes too low, a state or federal wildlife agency may list that species as threatened or endangered. • A threatened speciesmeans any species which is likely to become an endangered species within the foreseeable future throughout all or a significant portion of its range as defined in the Endangered Species Act.. • An endangered species is an animal or plant in danger of extinction within the foreseeable future throughout all or a significant portion of its range. • Endangered Species Act of 1973: this federal legislation provides a legal mechanism to conserve ecosystems in which we find endangered and threatened species, and provide programs for the conservation of those species, in order to prevent the extinction of native plants and animals. • Recoveryis the process where an endangered or threatened species’ population decline is slowed or reversed, or threats to its survival are removed, so that the long-term survival of the species in nature can be safeguarded. Source: www.care2.com
Enlisting the Public • Wildlife managers understand that because most habitat is owned privately, they must enlist the help of the public to ensure viable populations of wildlife remain throughout the country. • Wildlife managers depend on private landowners to support wildlife populations through proper land management. • One way in which landowners are engaged to develop and maintain wildlife habitat is through the Conservation Reserve Program. • The Conservation Reserve Program (CRP) is a land conservation program administered by the Farm Service Agency (FSA). • In exchange for a yearly rental payment, farmers enrolled in the program agree to remove environmentally sensitive land from agricultural production and plant species that will improve environmental health and quality. • Contracts for land enrolled in CRP are 10-15 years in length. • The long-term goal of the program is to re-establish valuable land cover to help improve water quality, prevent soil erosion, and reduce loss of wildlife habitat. (source: www.fsa.usda.gov/FSA) Source: minnesota.publicradio.org