Download
1 / 1
10 likes | 117 Vues
Kyle Beland, Jeremy Bibeau, Christopher Gagnon, Jacob Landry. Offshore Wind Turbine Array. Research Methodology. Background and Motivation. Characterize blade design/turbine performance in free stream in student wind tunnel (and validate in FPF)

E N D
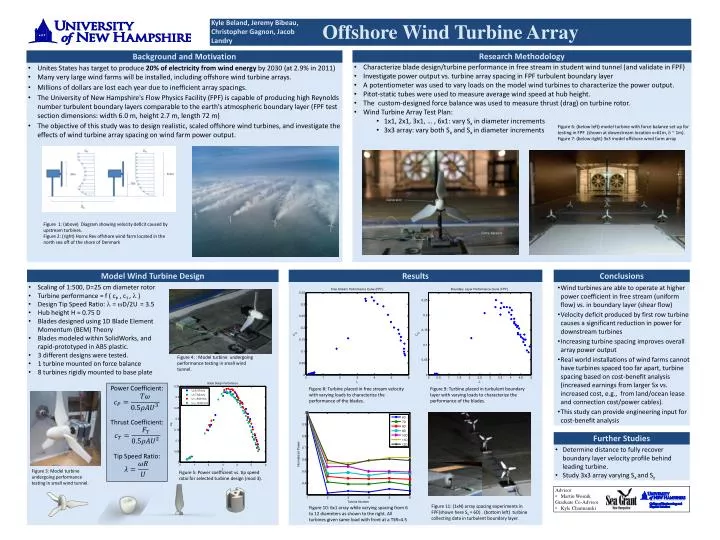
Kyle Beland, Jeremy Bibeau, Christopher Gagnon, Jacob Landry Offshore Wind Turbine Array Research Methodology Background and Motivation • Characterize blade design/turbine performance in free stream in student wind tunnel (and validate in FPF) • Investigate power output vs. turbine array spacing in FPF turbulent boundary layer • A potentiometer was used to vary loads on the model wind turbines to characterize the power output. • Pitot-static tubes were used to measure average wind speed at hub height. • The custom-designed force balance was used to measure thrust (drag) on turbine rotor. • Wind Turbine Array Test Plan: • 1x1, 2x1, 3x1, … , 6x1: vary Sx in diameter increments • 3x3 array: vary both Sx and Sxin diameter increments • Unites States has target to produce 20% of electricity from wind energy by 2030 (at 2.9% in 2011) • Many very large wind farms will be installed, including offshore wind turbine arrays. • Millions of dollars are lost each year due to inefficient array spacings. • The University of New Hampshire's Flow Physics Facility (FPF) is capable of producing high Reynolds number turbulent boundary layers comparable to the earth’s atmospheric boundary layer (FPF test section dimensions: width 6.0 m, height 2.7 m, length 72 m) • The objective of this study was to design realistic, scaled offshore wind turbines, and investigate the effects of wind turbine array spacing on wind farm power output. Figure 6: (below left) model turbine with force balance set up for testing in FPF (shown at downstream location x=61m, d ~ 1m). Figure 7: (below right) 3x3 model offshore wind farm array Generator Figure 1: (above) Diagram showing velocity deficit caused by upstream turbines. Figure 2: (right) Horns Rev offshore wind farm located in the north sea off of the shore of Denmark Force Balance Model Wind Turbine Design Results Conclusions • Scaling of 1:500, D=25 cm diameter rotor • Turbine performance = f ( cP , cT, l ) • Design Tip Speed Ratio: l = wD/2U = 3.5 • Hub height H = 0.75 D • Blades designed using 1D Blade Element Momentum (BEM) Theory • Blades modeled within SolidWorks, and rapid-prototyped in ABS plastic. • 3 different designs were tested. • 1 turbine mounted on force balance • 8 turbines rigidly mounted to base plate • Wind turbines are able to operate at higher power coefficient in free stream (uniform flow) vs. in boundary layer (shear flow) • Velocity deficit produced by first row turbine causes a significant reduction in power for downstream turbines • Increasing turbine spacing improves overall array power output • Real world installations of wind farms cannot have turbines spaced too far apart, turbine spacing based on cost-benefit analysis (increased earnings from larger Sx vs. increased cost, e.g., from land/ocean lease and connection cost/power cables). • This study can provide engineering input for cost-benefit analysis Figure 4: : Model turbine undergoing performance testing in small wind tunnel. Power Coefficient: Thrust Coefficient: Tip Speed Ratio: Figure 8: Turbine placed in free stream velocity with varying loads to characterize the performance of the blades. Figure 9: Turbine placed in turbulent boundary layer with varying loads to characterize the performance of the blades. Further Studies • Determine distance to fully recover boundary layer velocity profile behind leading turbine. • Study 3x3 array varying Sxand Sy Figure 3: Model turbine undergoing performance testing in small wind tunnel. Figure 5: Power coefficient vs. tip speed ratio for selected turbine design (mod 3). • Advisor • Martin Wosnik • Graduate Co-Advisor • Kyle Charmanski Figure 11: (1xN) array spacing experiments in FPF(shown here Sx = 6D) . (bottom left) turbine collecting data in turbulent boundary layer. Figure 10: 6x1 array while varying spacing from 6 to 12 diameters as shown to the right. All turbines given same load with front at a TSR=4.5