Download

1 / 13
130 likes | 264 Vues
Evaluation of Urban PM 2.5 Emission Inventories across the U.S. Prakash Bhave, Adam Reff, Alexis Zubrow, Venkatesh Rao U.S. Environmental Protection Agency CMAS Conference Chapel Hill, NC October 15 – 17, 2012. PM 2.5 Components ( μ g m -3 ). SO 4. CMAQ v4.7. NO 3. OC.

E N D
Evaluation of Urban PM2.5 Emission Inventories across the U.S. Prakash Bhave, Adam Reff, Alexis Zubrow, Venkatesh Rao U.S. Environmental Protection Agency CMAS Conference Chapel Hill, NC October 15 – 17, 2012
PM2.5 Components (μg m-3) SO4 CMAQ v4.7 NO3 OC IMPROVE Observations (2002 – 2006) Conclusions: CMAS 2010 • In the past decade, which modeling system refinements contributed most to PM2.5 performance improvement? • Meteorology inputs (2) • Emissions & deposition (4) • Atmospheric chemistry (2)
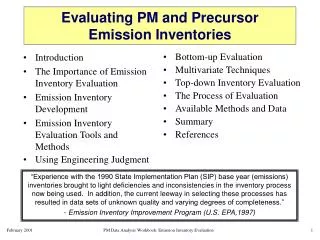
Background & Motivation U.S. has most detailed national inventory for PM2.5 Spatial resolution Source resolution Chemical resolution Inventory accuracy very difficult to check CTM is often used Can we find & fix gross inventory errors withoutrunning CMAQ? Reference: Reff et al. (ES&T, 2009) 2
Cass & McRae (ES&T, 1983) demonstrated a simple approach for PM2.5 inventory evaluation • Compare emission rates directly against ambient concentrations • Only works because, *most trace elements are conserved* • Results • Ti, Ni emissions too high • Zn too low • Ambient Cu data error • We applied same method to 2001 NEI in 21 cities… 3
Prior Evaluation: 2001 NEI Secondary Species Below MDL Si Al Ca Fe K Reff et al. (Intl Aerosol Conf. 2006)
Prior Evaluation: 2001 NEI • In many cities, we found positive biases in the emissions of • Agricultural soil • Unpaved road dust • Methodological Shortcomings • Limited number of sites (n = 21) • 36 km grid resolution • “old” version of NEI • Only able to identify gross overestimates • Unable to quantify the emission errors
Methodology • 2005ak NEI • Mobile emissions from 2005cr, output by MOVES • Spatial allocation: 12km ConUS grid • Temporal allocation: monthly • 85 source categories with unique PM2.5 speciation profiles • Aggregate to 159 Core-Based Statistical Areas (CBSA) • Multiply emissions by month- & site-specific dilution ratio Result > 7×10⁴ pairs of diluted emissions & ambient concentrations
Methodology • Apply principles of chemical mass balance (CMB) correction factor • Data in each city/month are fit separately • Key result: source-specificF value for each site & month
Methodology Force Fij to be positive Penalize fit for over-correcting the emissions Minimize this Account for measurement error
Preliminary Results F values for Agricultural Burning 100 • PM2.5 from crop burning is biased high by ~10x • Pouliot, McCarty, et al. have diagnosed the reason for these overestimates • Revisions will be incorporated into 2008 NEI 1 0.01 J F M A M J J A S O N D
Preliminary Results F values for Unpaved Road Dust 100 • PM2.5 from unpaved roads is biased high by ~30x • Is this entirely due to emissions error? • see poster by Appel et al. 1 0.01 J F M A M J J A S O N D
Preliminary Results F values for Unpaved Road Dust 100 1 0.01 J F M A M J J A S O N D Median of Monthly F values
Summary • Methodology to quantify source-specific biases in PM2.5 inventory has been developed • Preliminary results look quite promising! • In process of assessing our results for other source categories