3D Validation of Satellite AOD Products and Numerical Aerosol Forecast Models
Explore the validation process for satellite AOD products and aerosol forecast models, including 3D and 4D solutions, with real-time surface data and case studies on wildfires. Collaboration efforts among UMBC, NOAA, NASA, EPA, and UW aim to integrate multisensor data for better decision support.


3D Validation of Satellite AOD Products and Numerical Aerosol Forecast Models
E N D
Presentation Transcript
3-Dimensional Validation of Satellite AOD Products andthe Numerical Aerosol Forecast Models that Use Them Raymond Hoff, J. Engel-Cox, R. Rogers, N. Jordan, K. McCann, K. Mubenga Physics, MEES and JCET UMBC S. Palm, J. Spinhirne GSFC
Forecasting PM2.5 • NOAA-EPA MOU: 2013 PM Forecasts available to the public • 2006 PM forecasting goes into beta testing mode • How do you calibrate/validate these forecasts?
Surface Data - Real Time: AIRNoW CAMMS TEOM Nephelometer Beta Attenuation Been there, done that…..ozone says this just doesn't work Courtesy Jim Szykman, EPA
The problem with 4D-VAR assimilation • "Everybody says they should do something about getting data for 4D-VAR, but no one wants to do anything about it" • Two examples follow where it is obvious that 3D and 4D solutions are needed: • Alaskan Fires of 2004 • California Fire of 2003
A good IDEA Courtesy: CIMSS, UW
Linking optical properties and mass concentration Engel-Cox et al. 2004
Old Town TEOM MODIS AOD Baltimore, MD Summer 2004 July 21 Mixed down smoke July 9 High altitude smoke PM2.5 (g/m3) MODIS Aerosol Optical Depth Courtesy EPA/UWisconsin
U.S. Air Quality (The Smog Blog), http://alg.umbc.edu/usaq Daily posts NASA satellite images, EPA data, etc. Index & Links Over 1,000,000 hits over 19 months ~ 10,000 visits per month ~800 unique visitors per week including EPA, NASA, NOAA, & States
Data for: September 1, 2004 Click on a REALM Participant for their LIDAR data. http://alg.umbc.edu/REALM
REALM: Wisconsin lidar for July 2004 Eloranta, U. Wisc
July 17 July 18 July 19 MODIS
19 July 2004 21 July 2004
Low cloud 02:00 13:35 Smoke Midcloud Example 2: GLAS and the California Fires of October 2003 MODIS AQUA 19:43 UTC October 30
10-5 5 10-6 Smoke 10-6
October 31 12:08 23:01
This is tough…in 2D or 3D or 4D • Where was the smoke 6 hours previously? • We built a tool (CALIPSO-MORPH or C-MORPH)
The easy validation problems are over • Now it gets tough…. • Cal/Val has to be 3D+ to be able to integrate multiple profiling sensors • Cal/Val is going to have to involve a 4Danalysis tool • UMBC/NOAA/NASA/EPA/UW/CDC are collaborating on "3D-AQS", an attempt to integrate multisensor data into the EPA decision support system, AQS
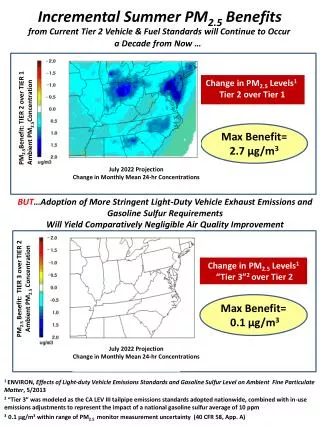
July 16-22, 2004: Evidence of Effects of Long Range Transport Originating Outside the Modeled Domain Evolution of Model and Observed Aerosol Optical Depth MODIS 7/16 7/17 7/18 7/19 7/20 7/22 Model 0 0.1 0.2 0.3 0.4 0.5 0.6 0.7 • Transport from outside the domain influences observed PM concentrations which • are grossly under-predicted during this period • Model picks up spatial signatures ahead of the front • Under predictions behind the front (due to LBCs)