HRIBF
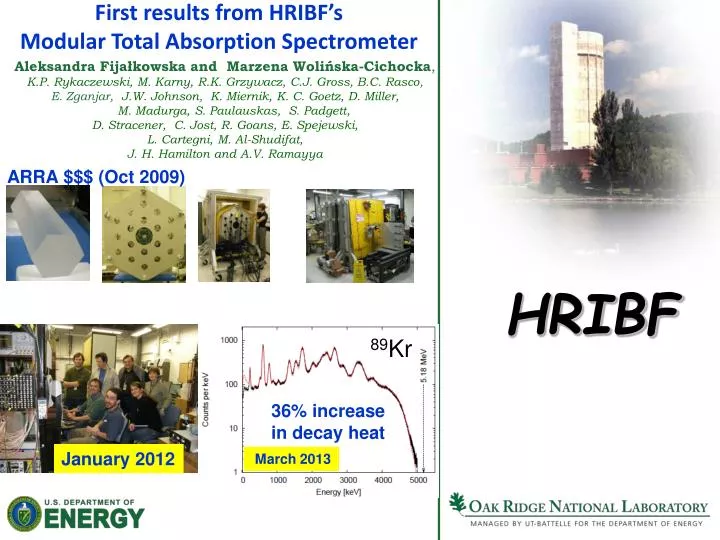
First results from HRIBF’s Modular Total Absorption Spectrometer. Aleksandra Fijałkowska and Marzena Woli ń ska-Cichocka , K.P. Rykaczewski, M. Karny, R.K. Grzywacz, C.J. Gross, B.C. Rasco ,

HRIBF
E N D
Presentation Transcript
First results from HRIBF’s Modular Total Absorption Spectrometer Aleksandra Fijałkowska and Marzena Wolińska-Cichocka, K.P. Rykaczewski, M. Karny, R.K. Grzywacz, C.J. Gross, B.C. Rasco, E. Zganjar, J.W. Johnson, K. Miernik,K. C. Goetz, D. Miller, M. Madurga, S. Paulauskas, S. Padgett, D. Stracener, C. Jost, R. Goans, E. Spejewski, L. Cartegni, M. Al-Shudifat, J. H. Hamilton and A.V. Ramayya ARRA $$$ (Oct 2009) HRIBF 89Kr 36% increase in decay heat January 2012 March 2013
Complex β-decays • β-transitions (mostly Gamow-Teller) are feeding highly excited states, • these many, weak β-transitions are followed by the cascades of γ-transitions in the daughter nucleus, • these weak γ-transitions are very difficult to detect with radiation detectors with low efficiency N-RICH PARENT (Z,N) β - transitions Total absorption -spectroscopy • to determine a true β-feeding and resulting γ-decay patterns (nuclear structure), • to determine a “decay heat” released by radioactive nuclei produced in nuclear fuels at power reactors, • (here measurement priorities listed in a study of OECD’s Nuclear Energy Agency in 2007 can serve as a guidance, • our CRP should produce “wanted” list for βn-emitters) - transitions The true picture of the neutron-rich parent nucleus (Z,N), with many weak β-transitions and following low intensity γ-transitions. J. Hardy et al., Physics Letters 71 B, 307, 1977 A. Algora et al., PRL 105, 202501, 2010 (K. P. Rykaczewski , Viewpoint in Physics 3, 94, 2010) DAUGHTER (Z+1, N-1)
Beta decay of very neutron-rich nuclei is indeed interesting and complex neutron detection 3Hen, VANDLE .... β and MTAS Part of beta-strength “under Sn “ is easier (not easy) to study and compare to models (easier if you have right tools like MTAS)
Modular Total Absorption Spectrometer (MTAS) • 19 NaI(Tl) hexagonal shape blocks, each 21” long and 8” maximum diameter (SGC, Hiram, OH) • the weight of a single detector is ~120 pounds, the total weight of the detector array is ~2 200 pounds • MTAS is mounted at the adjustable cart to facilitate measurements at different beam line height (47” – 53”) R&D for carbon fiber housing development 21” ~8” January 2011
MTAS shielding (background reduction) The weight of (mostly Pb) shielding for this setup is ~12 000 pounds(with about 1” layer of lead and ~0.75” lead in lead wool blankets) no blanket 1 Pb blanket • Rate for MTAS (most exposed single module) • without shielding ~16000 Hz (test stand near a lab with some activated materials) • with 4 Pb blankets and paraffin ~600 Hz • with “Pb house”, Pb blankets and paraffin shielding ~160 Hz 4 Pb blankets + paraffin 4 Pb blankets
AUXILIARY DETECTORS and MOVING TAPE DRIVE • HPGe detector for sample composition monitoring, • Si-detectors: • - 1 mm thick, 7 strips • - surrounding the tape-collected sample (tape by Ed Zganjar, LSU) • - the solid angle covered by two Si-detectors - around 95% of 4 • - the low energy threshold for electrons < 50 keV • - the energy resolution for 976 keV electrons - 2.5 % (~25 keV) collection point HPGe to tape drive MTAS active length 40mm 60mm Si- detectors 207Bi electron source Pb X-rays 72 -87 keV ~976 keV ~482 keV ~554 keV ~1048 keV
Beta energy loss spectra measured with segmented Si-detectors help to center radioactive samples in the middle of MTAS top SSD bottom SSD 8.5 mm
MTAS -efficiency verified using calibrated 137Cs, 54Mn and 65Zn single -line sources 99 98 MTAS total Simulations for: 96 92 89 “empty” MTAS 78 78 “running” MTAS with beam pipe, Si-detectors and tape drive inside 75 full energy of single -line in MTAS 71 Efficiency [%] full energy of single -line in central module Experimental points: 137Cs 662 keV 54Mn 835 keV 65Zn 1116 keV 26 23 18 full energy of single -line in inner ring 17 1 300 Energy [keV] “simulations team” A. Fijałkowska, B.C. Rasco, M. Karny
Measurements vs response function simulations black points – exp red line - simulations 137Cs 60Co Aleksandra Fijałkowska
Holifield Radioactive Ion Beam Facilityat Oak Ridge Tandem OLTF mass separator on-line to Tandem MTAS January 2012
Data ACQ cycle logistic
MTAS on-line to the HRIBF mass separator OLTF (On-line Test Facility aka UNISOR, m/Δm~600) Pixie16 HPGe Ge detector for monitoring collection point MTC January 2012 Data acquisition based on digital pulse processing and using XIA Pixie16 modules (100 MHz)
MTAS amplitude stability Temperature sensor outside MTAS(room temperature) four temperature sensors outside and inside MTAS (C.J. Gross) Temperature inside MTAS(under shielding) Amplitude stability is not a problem when room temperature is stable (gain matching/testing with 1115 keV -line from 65Zn) Work on an active amplification control in progress: K.C. Goetz, R. Grzywacz (UTK) (laser light pulser split over reference detector and MTAS modules)
MTAS at the HRIBF, January 2012 studies at mass A ~ 90 and 140 regions with OLTF and Tandem The decays of fission products produced at the HRIBF on-line mass separator (OLTF) using Tandem beam and studied with new Modular Total Absorption Spectrometer (MTAS) are marked by yellow and red squares. The label“1” indicates the highest priority for decay heat measurement established by the Nuclear Energy Agency evaluation in 2007.
A=142 test measurement 142Cs 1.68 s Qβ- = 7325 keV 142Ba 10.6 min Qβ- = 2181 keV 142La 91.1 min Qβ- = 4509 keV 142Ce stable Time scale of A=142 experiment and analysis time gates 1 min waiting and transport time [min] 30 0 500 560 205 485 280 min gate 142La 60 min gate “background” 29 min A=142 sample collection 30 min gate 142Ba + 142La
Total β-gated MTAS spectrum for 142Ba decay(142La contribution subtracted) beam contamination 142 La 142 Ba 142La -> 142Ce component evidence for new weak β-feeding ? Qβ=2212 keV MTAS measurement 2012 GEANT simulations with high resolution data from ENSDF ≈ TAGS data (Greenwood 1997) Earlier measurements for 142Ba decay: * high resolution Ge detectors data [see ENSDF /NDS 112, 8 (2011)] * total absorption spectroscopy [see Greenwood et al. NIM A390 (1997)] high resolution data are similar to TAGS data MTAS data agree with previously adopted β-decay pattern Marzena Wolinska-Cichocka et al., , in contr. to ND2013 conference
Total β-gated MTAS spectrum for 142La decay Earlier measurements for 142La decay included total absorption spectroscopy[see Greenwood et al. NIM A390 (1997)] beam contamination 142 Ce 142 La 641 keV (2+ -> 0+) Qβ=4504 keV MTAS measurement GEANT simulation with Greenwood’s TAGS data (1997) TAGS based simulations are close to MTAS data Marzena Wolinska-Cichocka et al., , in contr. to ND2013 conference
priority “1” 139Xe →139Cs decay (T1/2= 39.7 s) cumulative yield of 139Xe in nth + 235U fission is about 5% (# 7 in direct production of 4.3%) MTAS 18 new ’s and 11 new β-fed levels added to 139Xe decay scheme 240 -lines populating 63 levels known from 139Xe decay MTAS result: average gamma energy release per 139Xe decay increased from 935 keV to 1146 keV 23 % increase -Aleksandra Fijałkowska et al., in contr. to ND 2013
Measuredandmodified 139Xe decay in central and inner rings of MTAS Modular construction of MTAS helps to validate results !
priority “1” 89Kr →89Rb decay Cumulative yield of 89Kr in nth + 235U fission is about 4.5%. (# 13 in direct yield, of 3.4%) There are 57 β-fed levels in 89Rb daughter followed by 288 ’s listed in ENSDF ! MTAS vs ENSDF MTAS vs modified decay scheme MTAS result: average gamma energy release per 89Kr decay increased from 1801 keV to 2446 keV 36 % increase Marek Karny et al., in presentation at ND 2013 Aleksandra Fijałkowska et al., in contr. to ND 2013
Summary Modular Total Absorption Spectrometer with its auxiliary Si strip detectors, HPGe detector, shielding structure and tape collector system was constructed, characterized and applied to the decays studies of over twenty fission products, seven of highest NEA priority, at the HRIBF at Oak Ridge. It is by far the largest and the most efficient Total Absorption Spectrometer ever built (factor 7 in volume). Its modular construction helps to verify the analysis of complex decay patterns. Test decay chain 142Ba->142La->142Ce, where earlier measured high resolution and total absorption data were used to generate the β-strength distribution, demonstrated a reasonable agreement between MTAS experimental spectra and simulated MTAS response. New data on decays of abundant 235U fission products, 89Kr and 139Xe, demonstrated an increase in average -energy emitted per decay, by 36% and 23%, respectively. /preliminary analysis!/
Total β-gated MTAS spectrum for 142La decay Earlier measurements for 142La decay with high resolution Ge detectors data [see ENDSF /NDS 112, 8 (2011)] beam contamination 142 Ce 142 La 641 keV (2+ -> 0+) Qβ=4504 keV MTAS measurement GEANT simulation with high resolution data from ENSDF high resolution data differ from MTAS data