Download
1 / 79
800 likes | 975 Vues
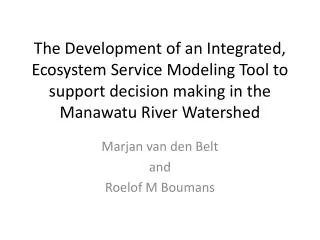
The Development of an Integrated, Ecosystem Service Modeling Tool to support decision making in the Manawatu River Watershed. Marjan van den Belt and Roelof M Boumans. Site description of the Manawatu River:. Content: What are the Natural resources and what are the issues?

E N D
The Development of an Integrated, Ecosystem Service Modeling Tool to support decision making in the Manawatu River Watershed Marjan van den Belt and Roelof M Boumans
Site description of the Manawatu River: • Content: What are the Natural resources and what are the issues? • Space: Location Size and distribution of uses • Time: Pre, post and future settlement dynamics (story)
Manawatu land cover: Pre- and Post Settlement Source: Landcare Research. Complements of Anthony Cole
Methods Scoping model Research model Management model
How do Modelling Tools support Planning and Adaptive Management? Source: van den Belt, 2009
Methods Integrated Freshwater Solutions (IFS) Scoping: Mediated Modeling Research model – FIT, Manawatu Model Management model - MIMES
Scoping Define scoping Mediated Modelling for Integrated Freshwater Solutions: A case study of the Manawatū Catchment
Research • Define research • FIT • Manawatu River, New Zealand • Multi-scale Integrated Modelling for Ecosystem Services (MIMES) to support science-policy dialogue:
Management Model • Define Management model • Management options suggested by the IFS process executed under the MIMES research model context.
Results • IFS • Manawatu MIMES base case scenario • Manawatu MIMES simulating: • IFS (stakeholder dialogue based) scenarios: • erosion control, • nutrient management, • riparian planting • Contribution of Economic and Ecosystem Services supplied and requested, when following the market or non-market values.
IFS – value context • Overall participants believed sedimentation, nutrient runoff, wastewater discharge and aquatic habitat were the main issues. • On the 16 of March 2011 these issues were verified by an expert science panel who discuss the underlying scientific questions. • Verification of the base case scenario. • Validation through calibration of model output. • Identifying Probability ranges for the non-controlable factors. • Identifying controllable factors of use in management scenarios. • Value context of issues (MRLF Accord Goals): Mana and Pride, Human Health, Economic Prosperity, Direct utility.
Ecosystem Service Valuationstarting framework Natural Capital Ecosystem Services Actions Values
Ecosystem functions: The capacity of natural processes and components to provide goods and services that satisfy human needs. (de Groot, 1992)Ecosystem Services: Valued Ecosystem Functions. R.S. de Groot et al. / Ecological Economics 41 (2002) 393–408
IFS-MM Result Land Use / Land Cover Forest, Wetland, Riparian, River/Lake, Urban, Dairy, Sheep&Beef, Horticulture Ecosystem Services Functioning index (slider) Impacts of Erosion, Nutrient runoff and habitat loss Actions Erosion control (SLUI) Nutrient management Riparian Planting Waste Water Treatment Restoration Values Cost of actions Benefit Transferred ES Stakeholder dialogue
Ecosystem Services • Storm protection • Food • Habitat provision • Nutrient cycling • Climate regulation and carbon cycling • Recreation • Natural Capital (and changes in land use) • Forest • Wetlands • Rivers and Streams • Estuary and coast • Dairy • Beef & Sheep • Horticulture • Urban • Impacts • Erosion and sedimentation • Nutrient runoff and eutrophication • Aquatic habitat • Action Plan • Fencing of Streams and riparian planting • SLUI and reforestation • Wetland restoration • Nitrogen management and herd homes • Point source reduction • (E)Valuation • Stakeholder participation • National, regional and local funding sources for actions. • CBA, EIA and CEA. • Cultural and spiritual values • Perceived or non-perceived benefits • Changes over time and time delays
IFS scoping model integrates important drivers, as identified by stakeholders • Erosion and sedimentation • Nitrogen runoff/leaking and eutrophication • Habitat and biodiversity
Sediment loading in tonnes per year 5 Million 3 Million 1 Million 1990 2000 2013 2020 2030 2040
Sediment loading in tonnes per year 5 Million 3 Million 1 Million 1990 2000 2013 2020 2030 2040
Sediment loading in tonnes per year 5 Million 3 Million 1 Million 1990 2000 2013 2020 2030 2040
Nitrogen loading in tonnes per year 10,000 5,000 0 1990 2000 2013 2020 2030 2040 Impact of SLUI on Nitrogen loading smaller than on Sediment loading blue line- 1: WITH SLUI red line -2: Without SLUI pink line -3: Reaching SLUI goals in 2020 instead of 2030
Nitrogen loading in tonnes per year 10,000 5,000 0 1990 2000 2013 2020 2030 2040 blue line- 1: base line under business-as-usual
Nitrogen loading in tonnes per year 10,000 5,000 0 1990 2000 2013 2020 2030 2040 Blue line- 1: base line under business-as-usual Red line- 2: stock exclusion $300,000
Nitrogen loading in tonnes per year 10,000 5,000 0 1990 2000 2013 2020 2030 2040 Blue 1: Base line under business-as-usual Red 2: Full effluent management Pink 3: Stock exclusion / fencing ($300,000) Green 4: Herd homes (40% N reduction)
Nitrogen loading in tonnes per year 10,000 5,000 0 1990 2000 2013 2020 2030 2040 Blue 1: Base line under business-as-usual Red 2: Currently funded and implemented Non-Point Source measures Pink: 25% reduction in Point Source waste water
Phosphorus loading in tonnes per year 300 150 0 1990 2000 2013 2020 2030 2040 Blue 1: Base line under business-as-usual Red 2: 50% reduction in Point Source waste water
MIMES boundaries • Manawatu is modelled as a closed system • 49 sub-watersheds • Daily time step + yearly aggregated outputs • Time extent 1995 – 2011 (weather data) • 2012 – 2100 (climate change scenarios)
Human-Environment Interaction Matrix – Full systems accounting
Supply of ES from LandCover • Forest gives a mix of ES
Production Econ Goods and Services • Cobb Douglas including ES from Land. • Land use use change, changes distribution of ES production • Distribution of ES drives production of Econ Goods and Services. • Production of Econ GS creates externalities by changing the ability of landcover to produce ES.
Scenarios • Erosion control • Nutrient Management • Riparian planting • Wastewater management • Restoration of Forest and wetland
Manawatu MIMES - Qualitative overview Water quality standards Rain Land environments Land cover Catchments Catchments Catchments Land use: N loading Water Water routing Hydrological model Ecosystem Services Demographics coefficients Land cover Ecosystem goods and services model Land use Conversion Land use Demographics: Built capital Demographics: population effect
Manawatu MIMES – Data base links Land Environments of New Zealand (LENZ) Database Resource Management Act 1991 13 underlying climate, landform and soil variables cliflo@niwa.co.nz 8 Land covers Catchments Catchments Freshwater Ecosystems of New Zealand (FENZ GIS) WATYIELD 7 land uses 8 user groups FENZ Emergent dynamics in Ecosystem Services (see output slide 17) Demographics By ANZSIC 2006 – industry classification The New Zealand Land Cover Database Dynamics in goods and service trade-offs Land use change as emergent behavior 7x7 Land use change Input for local investment scenarios Demographics: 1 Population effect 2 Business as Usual 3 Restoration Input for land use change scenarios
The Management Modelbased on IFS (stakeholder generated) Watershed Scenario Analyses
Manawatu MIMES – Data base links – Best Management Practices scenarios Land Environments of New Zealand (LENZ) Database Resource Management Act 1991 13 underlying climate, landform and soil variables cliflo@niwa.co.nz 8 Land covers Catchments Catchments Freshwater Ecosystems of New Zealand (FENZ GIS) WATYIELD 7 land uses 8 user groups FENZ Emergent dynamics in Ecosystem Services (see output slide 17) Demographics By ANZSIC 2006 – industry classification The New Zealand Land Cover Database Dynamics in goods and service trade-offs Land use change as emergent behavior 7x7 Land use change Input for local investment scenarios Demographics: 1 Population effect 2 Business as Usual 3 Restoration Input for land use change scenarios
Parameters derived from LENZ Level 2 LENZ Classification 1 F1` 2 C1 3 NULL_ 4 H1 5 B1 6 F7 7 P4 8 J4 9 C2 10 C3 11 P8 12 F4 13 I2 SLUI
Manawatu MIMES – Data base links – Land Use change scenarios Land Environments of New Zealand (LENZ) Database Resource Management Act 1991 13 underlying climate, landform and soil variables cliflo@niwa.co.nz 8 Land covers Catchments Catchments Freshwater Ecosystems of New Zealand (FENZ GIS) WATYIELD 7 land uses 8 user groups FENZ Emergent dynamics in Ecosystem Services (see output slide 17) Demographics By ANZSIC 2006 – industry classification The New Zealand Land Cover Database Dynamics in goods and service trade-offs Land use change as emergent behavior 7x7 Land use change Input for local investment scenarios Demographics: 1 Population effect 2 Business as Usual 3 Restoration Input for land use change scenarios
Manawatu MIMES – Data base links Land Environments of New Zealand (LENZ) Database Resource Management Act 1991 13 underlying climate, landform and soil variables cliflo@niwa.co.nz 8 Land covers Catchments Catchments Freshwater Ecosystems of New Zealand (FENZ GIS) WATYIELD 7 land uses 8 user groups FENZ Emergent dynamics in Ecosystem Services (see output slide 17) Demographics By ANZSIC 2006 – industry classification The New Zealand Land Cover Database Dynamics in goods and service trade-offs Land use change as emergent behavior 7x7 Land use change Input for local investment scenarios Demographics: 1 Population effect 2 Business as Usual 3 Restoration Input for land use change scenarios
Hydrological Routing Data uploaded in “connect to” informs Cond3 on what watershed (here) is connected to what watershed (there). Only those Surface water flow will be calculated for where watershed are connected (cond3 is true) Flows are based on water head differences and the speed of the water flow through the watersheds . The hydrological routing routine doubles to also account for Nitrogen exchanges among the watersheds
Manawatu MIMES – Data base links Land Environments of New Zealand (LENZ) Database Resource Management Act 1991 13 underlying climate, landform and soil variables cliflo@niwa.co.nz 8 Land covers Catchments Catchments Freshwater Ecosystems of New Zealand (FENZ GIS) WATYIELD 7 land uses 8 user groups FENZ Emergent dynamics in Ecosystem Services (see output slide 17) Demographics By ANZSIC 2006 – industry classification The New Zealand Land Cover Database Dynamics in goods and service trade-offs Land use change as emergent behavior 7x7 Land use change Input for local investment scenarios Demographics: 1 Population effect 2 Business as Usual 3 Restoration Input for land use change scenarios
1) Needs and wants by demographics for Labor, Capital, economic and ecological servicesIFS scenarios:1) Link to Environmental Impact. Days in watershed 3) Sector growth rate relative to economic prosperity Demographics by economic sector characteristics
The Management Modelbased on IFS (stakeholder generated) Watershed Scenario Analyses
Defining the interface to communicate scenarios; Organizing Model output spatial displays variables (25 variables for 49 sub-catchments)1) Upload of watershed polygon coordinates2) Inclusion of output variables to display3) Inclusion of graphical input variables