Download
1 / 1
31 likes | 163 Vues
The EOT2 (Empirical Orthogonal Teleconnections) method offers a novel approach to analyzing climate data sets by searching for points in space that explain the most variance across locations. This technique enables the extraction of orthogonal functions from two data sets, enhancing predictions of one variable based on another. By reversing the roles of time and space, EOT2 also provides a unique perspective on data relationships comparable to CCA and SVD. With significant advantages in directional predictions and explained variance, EOT2 serves as a valuable pedagogical tool in climate prediction methods.

E N D
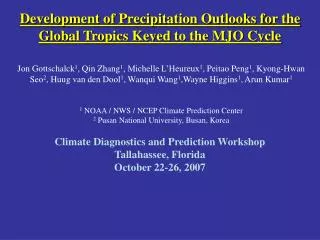
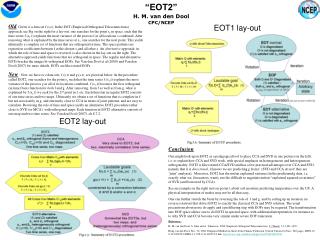
“EOT2” H. M. van den Dool CPC/NCEP Old: Given is a data set f (s,t). In the EOT (Empirical Orthogonal Teleconnections) approach, see Fig on the right for a lay-out, one searches for the point s1 in space, such that the time series f (s1,t) explains the most variance of the process f at all locations s combined. After removing what is explained by the time series at s1, one searches for the next point. This yields ultimately a complete set of functions that are orthogonal in time. The space patterns are regression coefficients between f at the chosen si and all other s. An alternative approach, in which the role of time and space is reversed, is also shown in the lay-out on the right. The alternative approach yields functions that are orthogonal in space. The regular and alternative EOTs bracket the unique bi-orthogonal EOFs. See Van den Dool et al (2000) and Van den Dool (2007) for more details. EOTs are like rotated EOFs. New : Now we have two data sets, f (s,t) and g (s,t), see pictorial below. In the procedure called EOT2, one searches for the point s1 such that the time series f (s1,t) explains the most variance of the process g at all of its locations combined. f (s1,t) becomes the first orthogonal (in time) basis function for both f and g. After removing, from f as well as from g, what is explained by f (s1,t) we seek for the 2nd point in f, etc. Each function in regular EOT2 consists of one time series and two maps. Ultimately we obtain a set of functions that is complete in f, but not necessarily in g, and extremely close to CCA in terms of joint patterns, and are easy to calculate. Reversing the role of time and space yields an alternative EOT2 procedure rather close to SVD (or MCA), with orthogonal maps. Each function in EOT2-alternative consists of one map and two time series. See Van den Dool (2007), ch 8.7.2. EOT1 lay-out EOT2 lay-out Conclusion One might look upon EOT2 as a pedagogical tool to place CCA and SVD in one picture (on the left), i.e. to explain how CCA and SVD work, with special emphasis on homogeneous and heterogeneous orthogonality. EOT2 is like rotated CCA/SVD and has a few practical advantages over CCA and SVD, namely that it is directional, it knows we are predicting g from f (SVD and CCA do not! they are ‘joint’ analyses). Moreover, EOT2 has the notion explained variance (in the predictand g data, i.e. exactly what we, forecasters, want), not the difficult to negotiate notion “explained squared covariance” of SVD (and borrowed by CCA). See an example on the right (not on poster), about soil moisture predicting temperature over the US. A physical interpretation of modes may not be all that easy. One can further stretch the brain by reversing the role of f and g, and by setting up an iteration (or reverse rotation) that drives EOT2 to exactly the classical CCA and SVD solution. The usual precautions about noise do apply and a prefiltering step with EOFs may be required. The transformation into EOF space allows one to do EOT2 in spectral space, with additional interpretation, for instance as to why SVD and CCA become very similar under severe EOF truncation. References: H. M. van den Dool, S. Saha and A. Johansson, 2000: Empirical Orthogonal Teleconnections. J. Climate, 13, 1421-1435. Huug van den Dool, Nov, 30, 2006: Empirical Methods in Short-Term Climate Prediction. Oxford University Press: 240 pages. ISBN-10: 0-19-920278-8 ISBN-13: 978-0-19-920278-2 link: http://www.oup.com/uk/catalogue/?ci=9780199202782